 |
||||||
|
|
||||||
Data Source for Association Study |
| 1. Method |
|---|
|
We extracted all association studies published in peer-reviewed journals from the SchizophreniaGene database. The extracted information included gene annotations, study information (e.g. ethnic groups), statistical analysis methods in association studies and their results, number of cases and controls, number of families (number of affected and unaffected family members), and genotypes of each polymorphism. Using our previously developed combined odds ratio (OR) method ( Sun et al. 2008), we first performed for each gene an extensive evaluation of risk allele of each marker based on its ORs, confidence intervals (CIs), and P values in multiple studies. We then calculated ORs using the risk alleles that we evaluated. The largest OR among the markers surveyed in each study was selected to represent its effect size in that association study. These OR values were next combined by using R package "meta" and a P value was obtained by a Z-test. Thus, this P value suggests a rough proxy of the magnitude of positive association evidence. Because the smaller P value indicates stronger evidence, we assigned a score 3 to a gene whose P value is < 0.001, 2 whose P value is [0.001 - 0.05), and 0 otherwise. The combined OR method requires at least two representative markers in each study and at least two association studies to combine their representative OR values ( Sun et al. 2008). Some genes having at least two positive association studies might have been excluded in the procedure. Because replication is still a great challenge in schizophrenia research, we assigned a score 2 to those genes with at least two positive results and a score 1 to those with only one positive result to reflect different extent of association. We applied this combinatory strategy (i.e. P value from combined OR method and scores based on the number of positive association studies) to all genes that had association report. Currently, we have 281 genes with the assigned scores ranging from 1 to 3. |
| 2. Dataset Description |
|
The association study generated a gene set containing 281 records in total, among which 278 are protein-coding genes, 2 are miscRNA genes and 1 with unknown gene-type. The following picture shows the distribution of the association specific scores described above. |
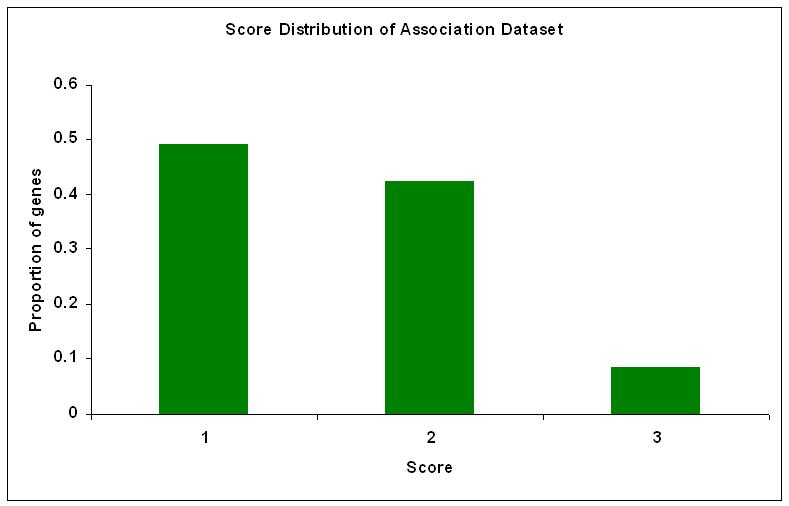 |
| Figure 1. Score distribution of association study defined gene set |
| References |
|
| Copyright © Bioinformatics and Systems Medicine Laboratory All Rights Reserved since 2009. |