Gene Page: NAALADL1
Summary ?
| GeneID | 10004 |
| Symbol | NAALADL1 |
| Synonyms | I100|NAALADASEL |
| Description | N-acetylated alpha-linked acidic dipeptidase-like 1 |
| Reference | MIM:602640|HGNC:HGNC:23536|Ensembl:ENSG00000168060|HPRD:07212|Vega:OTTHUMG00000165595 |
| Gene type | protein-coding |
| Map location | 11q12 |
| Pascal p-value | 0.109 |
| Fetal beta | -0.159 |
| DMG | 1 (# studies) |
Gene in Data Sources
| Gene set name | Method of gene set | Description | Info |
|---|---|---|---|
| CV:PGCnp | Genome-wide Association Study | GWAS | |
| DMG:Wockner_2014 | Genome-wide DNA methylation analysis | This dataset includes 4641 differentially methylated probes corresponding to 2929 unique genes between schizophrenia patients (n=24) and controls (n=24). | 1 |
Section I. Genetics and epigenetics annotation
 Differentially methylated gene
| Probe | Chromosome | Position | Nearest gene | P (dis) | Beta (dis) | FDR (dis) | Study |
|---|---|---|---|---|---|---|---|
| cg05596552 | 11 | 64826323 | NAALADL1 | 2.914E-4 | -0.281 | 0.039 | DMG:Wockner_2014 |
Section II. Transcriptome annotation
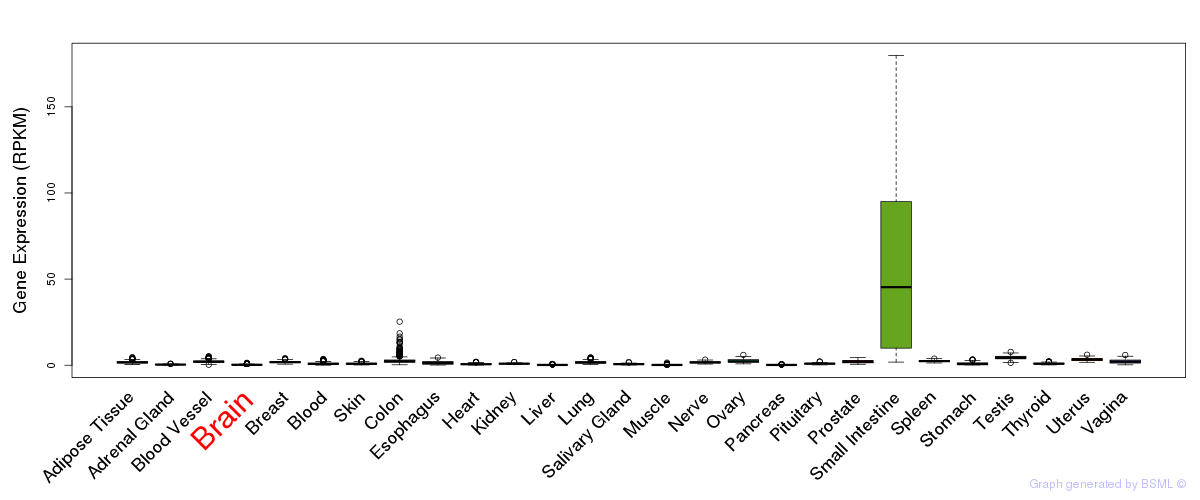
General gene expression (GTEx)
Gene expression during devlopment (BrainCloud)
Footnote:
A total of 269 time points ploted, with n=38 fetal samples (x=1:38). Each triangle represents one time point.
Gene expression of temporal and spatial changes (BrainSpan)
Footnote:
SC: sub-cortical regions; SM: sensory-motor regions; FC: frontal cortex; and TP: temporal-parietal cortex
ST1: fetal (13 - 26 postconception weeks), ST2: early infancy to late childhood (4 months to 11 years), and ST3: adolescence to adulthood (13 - 23 years)
The bar shown representes the lower 25% and upper 25% of the expression distribution.
Top co-expressed genes in brain regions
| Top 10 positively co-expressed genes | ||
| Gene | Pearson's Correlation | Spearman's Correlation |
| PLXNA4 | 0.76 | 0.77 |
| B3GALT1 | 0.70 | 0.74 |
| ADD2 | 0.68 | 0.81 |
| TRPC7 | 0.67 | 0.77 |
| RALGPS1 | 0.67 | 0.79 |
| DOK5 | 0.67 | 0.83 |
| BCL2 | 0.66 | 0.63 |
| NHSL1 | 0.66 | 0.65 |
| AFF2 | 0.66 | 0.81 |
| CSMD2 | 0.65 | 0.81 |
| Top 10 negatively co-expressed genes | ||
| Gene | Pearson's Correlation | Spearman's Correlation |
| FBXO2 | -0.46 | -0.64 |
| C5orf53 | -0.45 | -0.67 |
| AIFM3 | -0.45 | -0.72 |
| LDHD | -0.44 | -0.62 |
| HLA-F | -0.44 | -0.70 |
| ZNF385A | -0.44 | -0.64 |
| ALDOC | -0.44 | -0.67 |
| LHPP | -0.43 | -0.57 |
| TSC22D4 | -0.43 | -0.72 |
| ACYP2 | -0.43 | -0.53 |
Section V. Pathway annotation
| Pathway name | Pathway size | # SZGR 2.0 genes in pathway | Info |
|---|---|---|---|
| SABATES COLORECTAL ADENOMA DN | 291 | 176 | All SZGR 2.0 genes in this pathway |
| ENK UV RESPONSE KERATINOCYTE UP | 530 | 342 | All SZGR 2.0 genes in this pathway |
| LOPEZ MBD TARGETS | 957 | 597 | All SZGR 2.0 genes in this pathway |
| ROSS AML WITH PML RARA FUSION | 77 | 62 | All SZGR 2.0 genes in this pathway |
| ALCALAY AML BY NPM1 LOCALIZATION UP | 140 | 83 | All SZGR 2.0 genes in this pathway |
| MARIADASON REGULATED BY HISTONE ACETYLATION UP | 83 | 49 | All SZGR 2.0 genes in this pathway |
| CHANG IMMORTALIZED BY HPV31 UP | 84 | 55 | All SZGR 2.0 genes in this pathway |
| YOSHIMURA MAPK8 TARGETS UP | 1305 | 895 | All SZGR 2.0 genes in this pathway |
| VALK AML CLUSTER 12 | 30 | 20 | All SZGR 2.0 genes in this pathway |
| WIERENGA STAT5A TARGETS UP | 217 | 131 | All SZGR 2.0 genes in this pathway |
| WIERENGA STAT5A TARGETS GROUP1 | 136 | 76 | All SZGR 2.0 genes in this pathway |
| PEDRIOLI MIR31 TARGETS UP | 221 | 120 | All SZGR 2.0 genes in this pathway |
| ZWANG TRANSIENTLY UP BY 2ND EGF PULSE ONLY | 1725 | 838 | All SZGR 2.0 genes in this pathway |