Gene Page: CDH9
Summary ?
| GeneID | 1007 |
| Symbol | CDH9 |
| Synonyms | - |
| Description | cadherin 9 |
| Reference | MIM:609974|HGNC:HGNC:1768|Ensembl:ENSG00000113100|HPRD:13021|Vega:OTTHUMG00000090671 |
| Gene type | protein-coding |
| Map location | 5p14 |
| Pascal p-value | 0.803 |
| Sherlock p-value | 0.443 |
| Fetal beta | -3.396 |
| eGene | Myers' cis & trans |
| Support | CELL ADHESION AND TRANSSYNAPTIC SIGNALING |
Gene in Data Sources
| Gene set name | Method of gene set | Description | Info |
|---|---|---|---|
| CV:PGCnp | Genome-wide Association Study | GWAS | |
| PMID:cooccur | High-throughput literature-search | Systematic search in PubMed for genes co-occurring with SCZ keywords. A total of 3027 genes were included. | |
| Literature | High-throughput literature-search | Co-occurance with Schizophrenia keywords: schizophrenia,schizophrenias | Click to show details |
Section I. Genetics and epigenetics annotation
 eQTL annotation
| SNP ID | Chromosome | Position | eGene | Gene Entrez ID | pvalue | qvalue | TSS distance | eQTL type |
|---|---|---|---|---|---|---|---|---|
| rs994307 | chr7 | 9179288 | CDH9 | 1007 | 0.17 | trans | ||
| rs4789947 | chr17 | 77135790 | CDH9 | 1007 | 0.11 | trans | ||
| rs1795952 | chr17 | 77136677 | CDH9 | 1007 | 0.11 | trans | ||
| rs2707040 | chr17 | 77136833 | CDH9 | 1007 | 0.11 | trans |
Section II. Transcriptome annotation
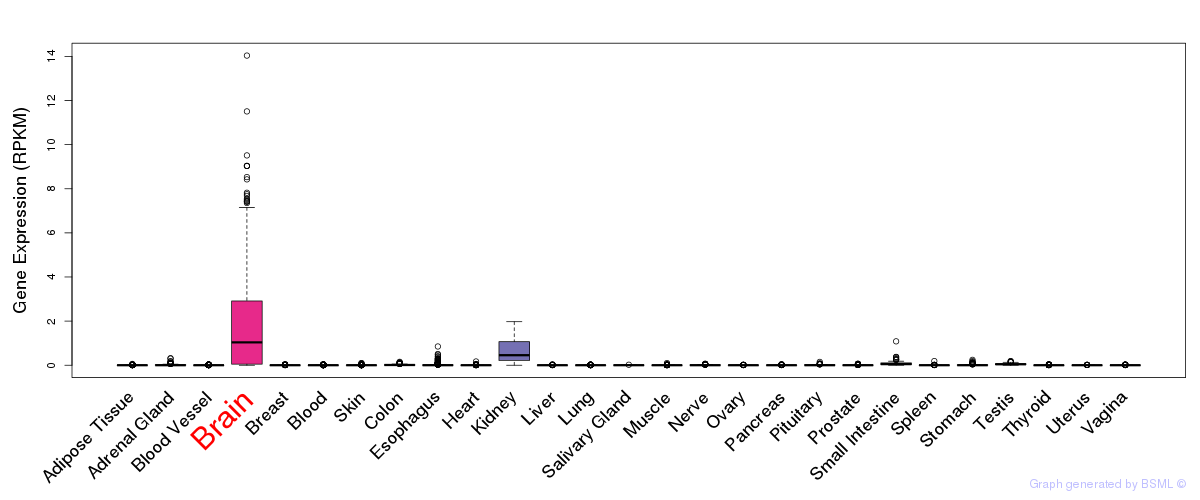
General gene expression (GTEx)
Gene expression during devlopment (BrainCloud)
Footnote:
A total of 269 time points ploted, with n=38 fetal samples (x=1:38). Each triangle represents one time point.
Gene expression of temporal and spatial changes (BrainSpan)
Footnote:
SC: sub-cortical regions; SM: sensory-motor regions; FC: frontal cortex; and TP: temporal-parietal cortex
ST1: fetal (13 - 26 postconception weeks), ST2: early infancy to late childhood (4 months to 11 years), and ST3: adolescence to adulthood (13 - 23 years)
The bar shown representes the lower 25% and upper 25% of the expression distribution.
Top co-expressed genes in brain regions
| Top 10 positively co-expressed genes | ||
| Gene | Pearson's Correlation | Spearman's Correlation |
| PCDHAC2 | 0.86 | 0.88 |
| PCDHA5 | 0.84 | 0.84 |
| JAZF1 | 0.82 | 0.85 |
| PRPS2 | 0.81 | 0.84 |
| STXBP5 | 0.81 | 0.85 |
| BTBD1 | 0.81 | 0.82 |
| GPR176 | 0.80 | 0.85 |
| CADM3 | 0.80 | 0.84 |
| SNAP91 | 0.80 | 0.86 |
| RP4-788L13.1 | 0.80 | 0.84 |
| Top 10 negatively co-expressed genes | ||
| Gene | Pearson's Correlation | Spearman's Correlation |
| AP002478.3 | -0.52 | -0.59 |
| C11orf67 | -0.52 | -0.58 |
| AF347015.21 | -0.50 | -0.50 |
| MT-CO2 | -0.49 | -0.52 |
| ACSF2 | -0.49 | -0.55 |
| AF347015.26 | -0.49 | -0.48 |
| EIF4EBP3 | -0.48 | -0.53 |
| AF347015.31 | -0.48 | -0.50 |
| FXYD1 | -0.48 | -0.46 |
| AF347015.2 | -0.47 | -0.47 |
Section V. Pathway annotation
| Pathway name | Pathway size | # SZGR 2.0 genes in pathway | Info |
|---|---|---|---|
| REACTOME CELL CELL COMMUNICATION | 120 | 77 | All SZGR 2.0 genes in this pathway |
| REACTOME ADHERENS JUNCTIONS INTERACTIONS | 27 | 20 | All SZGR 2.0 genes in this pathway |
| REACTOME CELL CELL JUNCTION ORGANIZATION | 56 | 31 | All SZGR 2.0 genes in this pathway |
| REACTOME CELL JUNCTION ORGANIZATION | 78 | 43 | All SZGR 2.0 genes in this pathway |
| TAKEDA TARGETS OF NUP98 HOXA9 FUSION 6HR UP | 85 | 54 | All SZGR 2.0 genes in this pathway |