Gene Page: PDCD7
Summary ?
| GeneID | 10081 |
| Symbol | PDCD7 |
| Synonyms | ES18|HES18 |
| Description | programmed cell death 7 |
| Reference | MIM:608138|HGNC:HGNC:8767|Ensembl:ENSG00000090470|HPRD:09736|Vega:OTTHUMG00000133117 |
| Gene type | protein-coding |
| Map location | 15q22.31 |
| Pascal p-value | 0.469 |
| Sherlock p-value | 0.662 |
| Fetal beta | -0.117 |
| DMG | 2 (# studies) |
| eGene | Myers' cis & trans |
Gene in Data Sources
| Gene set name | Method of gene set | Description | Info |
|---|---|---|---|
| CV:PGCnp | Genome-wide Association Study | GWAS | |
| DMG:Nishioka_2013 | Genome-wide DNA methylation analysis | The authors investigated the methylation profiles of DNA in peripheral blood cells from 18 patients with first-episode schizophrenia (FESZ) and from 15 normal controls. | 2 |
| DMG:Wockner_2014 | Genome-wide DNA methylation analysis | This dataset includes 4641 differentially methylated probes corresponding to 2929 unique genes between schizophrenia patients (n=24) and controls (n=24). | 2 |
| Network | Shortest path distance of core genes in the Human protein-protein interaction network | Contribution to shortest path in PPI network: 0.0263 |
Section I. Genetics and epigenetics annotation
 Differentially methylated gene
| Probe | Chromosome | Position | Nearest gene | P (dis) | Beta (dis) | FDR (dis) | Study |
|---|---|---|---|---|---|---|---|
| cg23044169 | 15 | 65426800 | PDCD7 | 1.61E-6 | 0.303 | 0.008 | DMG:Wockner_2014 |
| cg05179880 | 15 | 65426293 | PDCD7 | -0.027 | 0.27 | DMG:Nishioka_2013 |
eQTL annotation
| SNP ID | Chromosome | Position | eGene | Gene Entrez ID | pvalue | qvalue | TSS distance | eQTL type |
|---|---|---|---|---|---|---|---|---|
| rs9846383 | chr3 | 191885041 | PDCD7 | 10081 | 0.16 | trans |
Section II. Transcriptome annotation
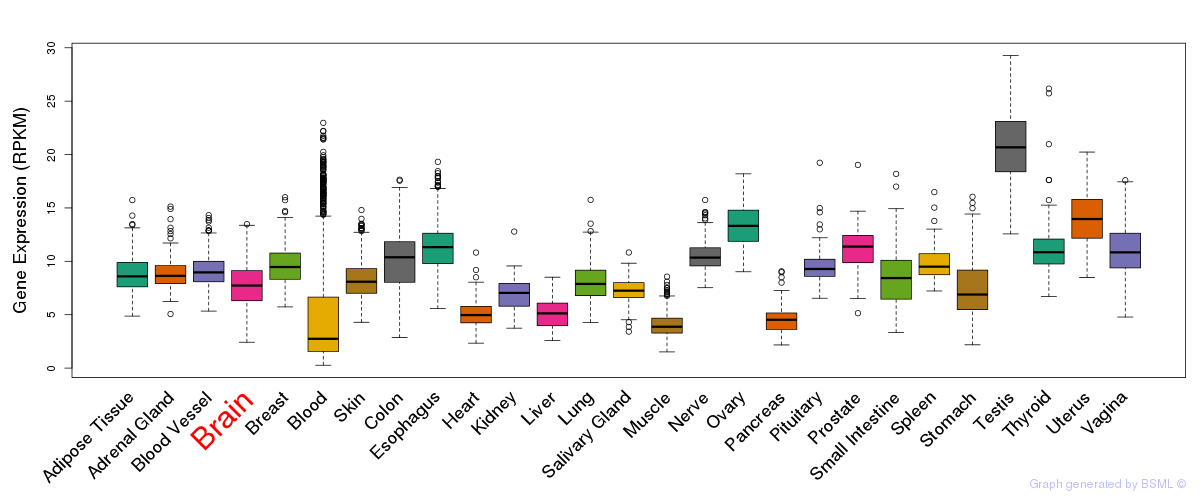
General gene expression (GTEx)
Gene expression during devlopment (BrainCloud)
Footnote:
A total of 269 time points ploted, with n=38 fetal samples (x=1:38). Each triangle represents one time point.
Gene expression of temporal and spatial changes (BrainSpan)
Footnote:
SC: sub-cortical regions; SM: sensory-motor regions; FC: frontal cortex; and TP: temporal-parietal cortex
ST1: fetal (13 - 26 postconception weeks), ST2: early infancy to late childhood (4 months to 11 years), and ST3: adolescence to adulthood (13 - 23 years)
The bar shown representes the lower 25% and upper 25% of the expression distribution.
Top co-expressed genes in brain regions
| Top 10 positively co-expressed genes | ||
| Gene | Pearson's Correlation | Spearman's Correlation |
| ACD | 0.89 | 0.90 |
| TOR2A | 0.88 | 0.91 |
| C16orf59 | 0.88 | 0.90 |
| ABCC10 | 0.88 | 0.91 |
| C1orf159 | 0.87 | 0.90 |
| C17orf70 | 0.87 | 0.90 |
| CLN3 | 0.87 | 0.88 |
| RCE1 | 0.87 | 0.91 |
| C7orf27 | 0.87 | 0.91 |
| GTPBP3 | 0.86 | 0.89 |
| Top 10 negatively co-expressed genes | ||
| Gene | Pearson's Correlation | Spearman's Correlation |
| AF347015.27 | -0.64 | -0.75 |
| AF347015.31 | -0.62 | -0.72 |
| AF347015.33 | -0.62 | -0.72 |
| MT-CO2 | -0.61 | -0.72 |
| AF347015.8 | -0.60 | -0.73 |
| MT-CYB | -0.60 | -0.71 |
| C5orf53 | -0.59 | -0.64 |
| S100B | -0.58 | -0.67 |
| AF347015.15 | -0.57 | -0.69 |
| COPZ2 | -0.57 | -0.64 |
Section III. Gene Ontology annotation
| Biological process | GO term | Evidence | Neuro keywords | PubMed ID |
|---|---|---|---|---|
| GO:0008380 | RNA splicing | IC | 15146077 | |
| GO:0006917 | induction of apoptosis | IEA | - | |
| GO:0006917 | induction of apoptosis | ISS | 10037816 | |
| GO:0006915 | apoptosis | IEA | - | |
| GO:0051384 | response to glucocorticoid stimulus | IEA | - | |
| GO:0051384 | response to glucocorticoid stimulus | ISS | 10037816 | |
| Cellular component | GO term | Evidence | Neuro keywords | PubMed ID |
| GO:0005634 | nucleus | IEA | - | |
| GO:0005689 | U12-dependent spliceosome | IDA | 15146077 |
Section V. Pathway annotation
| Pathway name | Pathway size | # SZGR 2.0 genes in pathway | Info |
|---|---|---|---|
| LIANG HEMATOPOIESIS STEM CELL NUMBER SMALL VS HUGE DN | 33 | 22 | All SZGR 2.0 genes in this pathway |
| MARTINEZ RB1 TARGETS DN | 543 | 317 | All SZGR 2.0 genes in this pathway |
| MARTINEZ TP53 TARGETS DN | 593 | 372 | All SZGR 2.0 genes in this pathway |
| MARTINEZ RB1 AND TP53 TARGETS DN | 591 | 366 | All SZGR 2.0 genes in this pathway |
| ACEVEDO LIVER CANCER UP | 973 | 570 | All SZGR 2.0 genes in this pathway |
| ACEVEDO LIVER TUMOR VS NORMAL ADJACENT TISSUE UP | 863 | 514 | All SZGR 2.0 genes in this pathway |
Section VI. microRNA annotation
| miRNA family | Target position | miRNA ID | miRNA seq | ||
|---|---|---|---|---|---|
| UTR start | UTR end | Match method | |||
| miR-410 | 1295 | 1301 | m8 | hsa-miR-410 | AAUAUAACACAGAUGGCCUGU |
- SZ: miRNAs which differentially expressed in brain cortex of schizophrenia patients comparing with control samples using microarray. Click here to see the list of SZ related miRNAs.
- Brain: miRNAs which are expressed in brain based on miRNA microarray expression studies. Click here to see the list of brain related miRNAs.