Gene Page: NUBP2
Summary ?
| GeneID | 10101 |
| Symbol | NUBP2 |
| Synonyms | CFD1|NBP 2|NUBP1 |
| Description | nucleotide binding protein 2 |
| Reference | MIM:610779|HGNC:HGNC:8042|Ensembl:ENSG00000095906|HPRD:14846|Vega:OTTHUMG00000128639 |
| Gene type | protein-coding |
| Map location | 16p13.3 |
| Pascal p-value | 0.02 |
| Sherlock p-value | 0.794 |
| Fetal beta | 0.46 |
| DMG | 1 (# studies) |
| eGene | Myers' cis & trans Meta |
Gene in Data Sources
| Gene set name | Method of gene set | Description | Info |
|---|---|---|---|
| CV:PGCnp | Genome-wide Association Study | GWAS | |
| DMG:Nishioka_2013 | Genome-wide DNA methylation analysis | The authors investigated the methylation profiles of DNA in peripheral blood cells from 18 patients with first-episode schizophrenia (FESZ) and from 15 normal controls. | 2 |
| DMG:Wockner_2014 | Genome-wide DNA methylation analysis | This dataset includes 4641 differentially methylated probes corresponding to 2929 unique genes between schizophrenia patients (n=24) and controls (n=24). | 2 |
Section I. Genetics and epigenetics annotation
 Differentially methylated gene
| Probe | Chromosome | Position | Nearest gene | P (dis) | Beta (dis) | FDR (dis) | Study |
|---|---|---|---|---|---|---|---|
| cg02898499 | 16 | 1831468 | SPSB3;NUBP2 | 5.915E-4 | 0.226 | 0.05 | DMG:Wockner_2014 |
| cg03700218 | 16 | 1832709 | NUBP2 | -0.021 | 0.29 | DMG:Nishioka_2013 |
eQTL annotation
| SNP ID | Chromosome | Position | eGene | Gene Entrez ID | pvalue | qvalue | TSS distance | eQTL type |
|---|---|---|---|---|---|---|---|---|
| rs2064289 | chr16 | 1593644 | NUBP2 | 10101 | 0 | cis | ||
| rs2575369 | chr16 | 1817430 | NUBP2 | 10101 | 0.11 | cis | ||
| rs3848346 | chr16 | 1889820 | NUBP2 | 10101 | 9.793E-10 | cis | ||
| rs3848348 | chr16 | 1890055 | NUBP2 | 10101 | 4.492E-9 | cis | ||
| rs1742419 | chr16 | 1901808 | NUBP2 | 10101 | 1.101E-8 | cis | ||
| rs1625393 | chr16 | 1901892 | NUBP2 | 10101 | 1.474E-9 | cis | ||
| rs1657117 | chr16 | 1903650 | NUBP2 | 10101 | 1.474E-9 | cis | ||
| rs7199384 | chr16 | 1904586 | NUBP2 | 10101 | 1.666E-7 | cis | ||
| rs453494 | chr16 | 1916102 | NUBP2 | 10101 | 4.56E-9 | cis | ||
| rs1657094 | chr16 | 1920628 | NUBP2 | 10101 | 1.521E-8 | cis | ||
| rs1657095 | chr16 | 1920677 | NUBP2 | 10101 | 2.153E-7 | cis | ||
| rs2917523 | chr16 | 1920739 | NUBP2 | 10101 | 5.921E-9 | cis | ||
| rs2974856 | chr16 | 1920756 | NUBP2 | 10101 | 1.572E-7 | cis | ||
| rs2982235 | chr16 | 1920791 | NUBP2 | 10101 | 1.616E-7 | cis | ||
| rs911392 | chr16 | 1947258 | NUBP2 | 10101 | 9.888E-8 | cis | ||
| rs1742464 | chr16 | 1947334 | NUBP2 | 10101 | 6.52E-8 | cis | ||
| rs2982447 | chr16 | 1947412 | NUBP2 | 10101 | 1.21E-7 | cis | ||
| rs1742402 | chr16 | 1972815 | NUBP2 | 10101 | 0.01 | cis | ||
| rs2064289 | chr16 | 1593644 | NUBP2 | 10101 | 0.13 | trans | ||
| rs3848346 | chr16 | 1889820 | NUBP2 | 10101 | 2.406E-7 | trans | ||
| rs3848348 | chr16 | 1890055 | NUBP2 | 10101 | 1.097E-6 | trans | ||
| rs1742419 | chr16 | 1901808 | NUBP2 | 10101 | 2.621E-6 | trans | ||
| rs1625393 | chr16 | 1901892 | NUBP2 | 10101 | 3.607E-7 | trans | ||
| rs1657117 | chr16 | 1903650 | NUBP2 | 10101 | 3.607E-7 | trans | ||
| rs7199384 | chr16 | 1904586 | NUBP2 | 10101 | 3.624E-5 | trans | ||
| rs453494 | chr16 | 1916102 | NUBP2 | 10101 | 1.114E-6 | trans | ||
| rs1657094 | chr16 | 1920628 | NUBP2 | 10101 | 3.606E-6 | trans | ||
| rs1657095 | chr16 | 1920677 | NUBP2 | 10101 | 4.549E-5 | trans | ||
| rs2917523 | chr16 | 1920739 | NUBP2 | 10101 | 1.447E-6 | trans | ||
| rs2974856 | chr16 | 1920756 | NUBP2 | 10101 | 3.398E-5 | trans | ||
| rs2982235 | chr16 | 1920791 | NUBP2 | 10101 | 3.519E-5 | trans | ||
| rs911392 | chr16 | 1947258 | NUBP2 | 10101 | 2.149E-5 | trans | ||
| rs1742464 | chr16 | 1947334 | NUBP2 | 10101 | 1.463E-5 | trans | ||
| rs2982447 | chr16 | 1947412 | NUBP2 | 10101 | 2.661E-5 | trans |
Section II. Transcriptome annotation
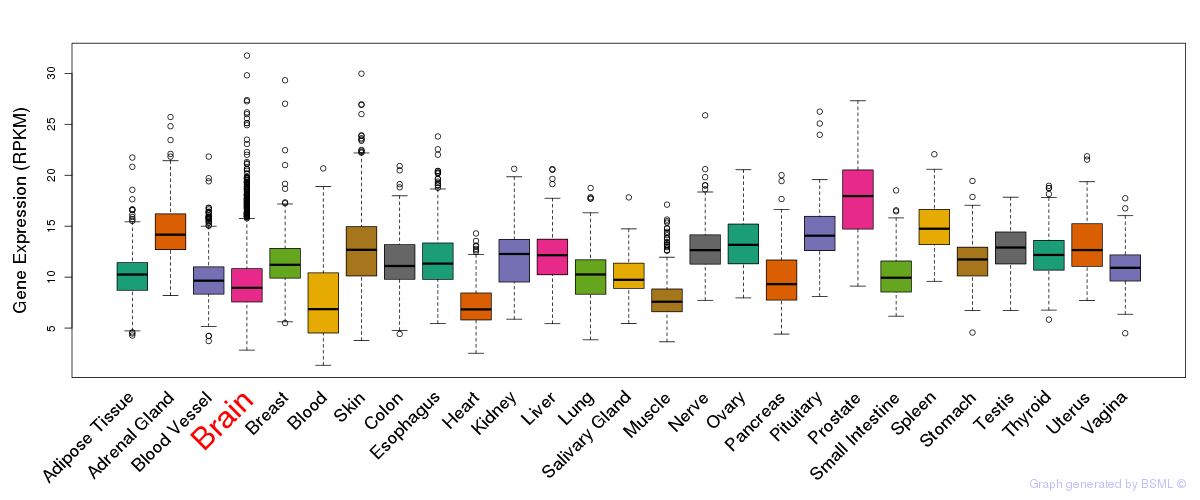
General gene expression (GTEx)
Gene expression during devlopment (BrainCloud)
Footnote:
A total of 269 time points ploted, with n=38 fetal samples (x=1:38). Each triangle represents one time point.
Gene expression of temporal and spatial changes (BrainSpan)
Footnote:
SC: sub-cortical regions; SM: sensory-motor regions; FC: frontal cortex; and TP: temporal-parietal cortex
ST1: fetal (13 - 26 postconception weeks), ST2: early infancy to late childhood (4 months to 11 years), and ST3: adolescence to adulthood (13 - 23 years)
The bar shown representes the lower 25% and upper 25% of the expression distribution.
Top co-expressed genes in brain regions
| Top 10 positively co-expressed genes | ||
| Gene | Pearson's Correlation | Spearman's Correlation |
| PON2 | 0.89 | 0.89 |
| ALDH1L1 | 0.85 | 0.89 |
| STOX1 | 0.82 | 0.86 |
| HADHB | 0.81 | 0.90 |
| SLC44A3 | 0.81 | 0.79 |
| PLSCR4 | 0.81 | 0.80 |
| RANBP3L | 0.81 | 0.88 |
| BBOX1 | 0.80 | 0.87 |
| GJA1 | 0.80 | 0.78 |
| ADHFE1 | 0.80 | 0.90 |
| Top 10 negatively co-expressed genes | ||
| Gene | Pearson's Correlation | Spearman's Correlation |
| RUSC1 | -0.62 | -0.74 |
| FAM40A | -0.62 | -0.72 |
| RTF1 | -0.62 | -0.72 |
| RAB35 | -0.62 | -0.74 |
| L1CAM | -0.62 | -0.73 |
| LSM14B | -0.61 | -0.71 |
| MARCH4 | -0.61 | -0.74 |
| DPF1 | -0.61 | -0.73 |
| SH3BP5 | -0.61 | -0.72 |
| CSRNP2 | -0.61 | -0.74 |
Section V. Pathway annotation
| Pathway name | Pathway size | # SZGR 2.0 genes in pathway | Info |
|---|---|---|---|
| UDAYAKUMAR MED1 TARGETS UP | 135 | 82 | All SZGR 2.0 genes in this pathway |
| DAIRKEE TERT TARGETS UP | 380 | 213 | All SZGR 2.0 genes in this pathway |
| SPIELMAN LYMPHOBLAST EUROPEAN VS ASIAN UP | 479 | 299 | All SZGR 2.0 genes in this pathway |
| LOPEZ MBD TARGETS | 957 | 597 | All SZGR 2.0 genes in this pathway |
| BENPORATH MYC MAX TARGETS | 775 | 494 | All SZGR 2.0 genes in this pathway |
| AMIT EGF RESPONSE 20 MCF10A | 14 | 9 | All SZGR 2.0 genes in this pathway |
| NIKOLSKY BREAST CANCER 16P13 AMPLICON | 120 | 49 | All SZGR 2.0 genes in this pathway |
| SANSOM APC MYC TARGETS | 217 | 138 | All SZGR 2.0 genes in this pathway |
| DANG BOUND BY MYC | 1103 | 714 | All SZGR 2.0 genes in this pathway |