Gene Page: CLEC3A
Summary ?
| GeneID | 10143 |
| Symbol | CLEC3A |
| Synonyms | CLECSF1 |
| Description | C-type lectin domain family 3 member A |
| Reference | MIM:613588|HGNC:HGNC:2052|Ensembl:ENSG00000166509|HPRD:13072|Vega:OTTHUMG00000137620 |
| Gene type | protein-coding |
| Map location | 16q23 |
| Pascal p-value | 0.046 |
| Fetal beta | 0.115 |
| eGene | Nucleus accumbens basal ganglia Meta |
| Support | CompositeSet |
Gene in Data Sources
| Gene set name | Method of gene set | Description | Info |
|---|---|---|---|
| CV:PGCnp | Genome-wide Association Study | GWAS | |
| DNM:Fromer_2014 | Whole Exome Sequencing analysis | This study reported a WES study of 623 schizophrenia trios, reporting DNMs using genomic DNA. |
Section I. Genetics and epigenetics annotation
 DNM table
| Gene | Chromosome | Position | Ref | Alt | Transcript | AA change | Mutation type | Sift | CG46 | Trait | Study |
|---|---|---|---|---|---|---|---|---|---|---|---|
| CLEC3A | chr16 | 78064707 | G | A | NM_001244755 NM_005752 | p.136R>K p.197R>K | missense missense | Schizophrenia | DNM:Fromer_2014 |
Section II. Transcriptome annotation
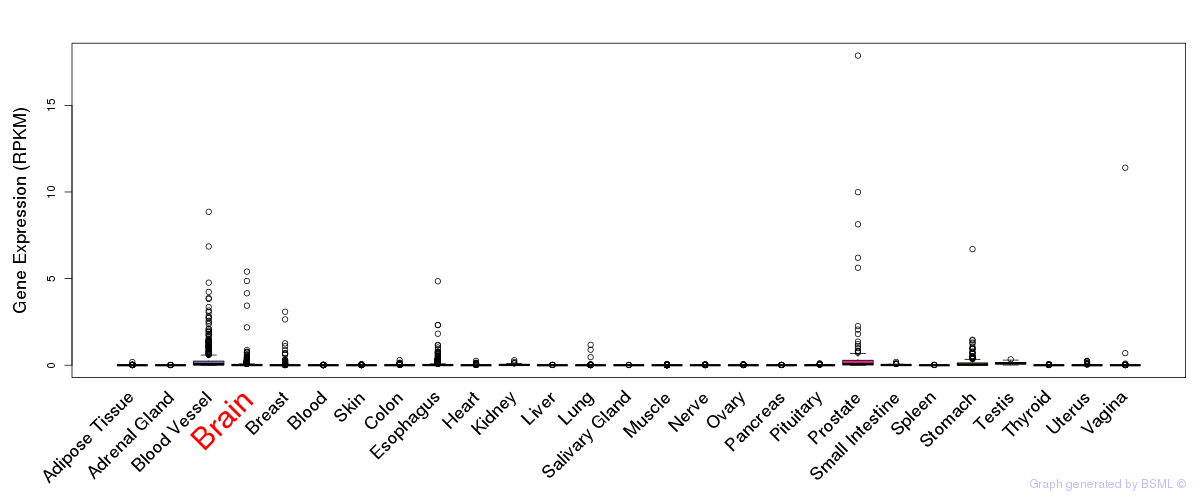
General gene expression (GTEx)
Gene expression during devlopment (BrainCloud)
Footnote:
A total of 269 time points ploted, with n=38 fetal samples (x=1:38). Each triangle represents one time point.
Gene expression of temporal and spatial changes (BrainSpan)
Footnote:
SC: sub-cortical regions; SM: sensory-motor regions; FC: frontal cortex; and TP: temporal-parietal cortex
ST1: fetal (13 - 26 postconception weeks), ST2: early infancy to late childhood (4 months to 11 years), and ST3: adolescence to adulthood (13 - 23 years)
The bar shown representes the lower 25% and upper 25% of the expression distribution.
Top co-expressed genes in brain regions
| Top 10 positively co-expressed genes | ||
| Gene | Pearson's Correlation | Spearman's Correlation |
| INTS10 | 0.85 | 0.86 |
| VDAC2 | 0.85 | 0.87 |
| FARSB | 0.84 | 0.87 |
| TAF9 | 0.84 | 0.84 |
| AKIRIN2 | 0.83 | 0.83 |
| UBE2E3 | 0.83 | 0.86 |
| AL109927.1 | 0.83 | 0.85 |
| TSG101 | 0.83 | 0.88 |
| KLHDC2 | 0.83 | 0.86 |
| CBARA1 | 0.82 | 0.81 |
| Top 10 negatively co-expressed genes | ||
| Gene | Pearson's Correlation | Spearman's Correlation |
| MT-CO2 | -0.74 | -0.73 |
| AF347015.2 | -0.74 | -0.78 |
| MT-CYB | -0.74 | -0.75 |
| AF347015.8 | -0.74 | -0.75 |
| AF347015.26 | -0.73 | -0.79 |
| AF347015.31 | -0.73 | -0.73 |
| AF347015.15 | -0.72 | -0.75 |
| AF347015.33 | -0.71 | -0.72 |
| AF347015.27 | -0.71 | -0.73 |
| AIFM3 | -0.66 | -0.70 |
Section V. Pathway annotation
| Pathway name | Pathway size | # SZGR 2.0 genes in pathway | Info |
|---|---|---|---|
| ZWANG TRANSIENTLY UP BY 2ND EGF PULSE ONLY | 1725 | 838 | All SZGR 2.0 genes in this pathway |
| NABA ECM AFFILIATED | 171 | 89 | All SZGR 2.0 genes in this pathway |
| NABA MATRISOME ASSOCIATED | 753 | 411 | All SZGR 2.0 genes in this pathway |
| NABA MATRISOME | 1028 | 559 | All SZGR 2.0 genes in this pathway |