Gene Page: ALYREF
Summary ?
| GeneID | 10189 |
| Symbol | ALYREF |
| Synonyms | ALY|ALY/REF|BEF|REF|THOC4 |
| Description | Aly/REF export factor |
| Reference | MIM:604171|HGNC:HGNC:19071|Ensembl:ENSG00000183684|HPRD:09168|Vega:OTTHUMG00000160470 |
| Gene type | protein-coding |
| Map location | 17q25.3 |
| Pascal p-value | 0.735 |
| Sherlock p-value | 0.073 |
| Fetal beta | 0.572 |
| DMG | 1 (# studies) |
Gene in Data Sources
| Gene set name | Method of gene set | Description | Info |
|---|---|---|---|
| DMG:Jaffe_2016 | Genome-wide DNA methylation analysis | This dataset includes 2,104 probes/CpGs associated with SZ patients (n=108) compared to 136 controls at Bonferroni-adjusted P < 0.05. | 1 |
Section I. Genetics and epigenetics annotation
 Differentially methylated gene
| Probe | Chromosome | Position | Nearest gene | P (dis) | Beta (dis) | FDR (dis) | Study |
|---|---|---|---|---|---|---|---|
| cg05147328 | 17 | 79849438 | ALYREF | 1.25E-8 | -0.008 | 5.08E-6 | DMG:Jaffe_2016 |
eQTL annotation
| SNP ID | Chromosome | Position | eGene | Gene Entrez ID | pvalue | qvalue | TSS distance | eQTL type |
|---|---|---|---|---|---|---|---|---|
| rs11068651 | chr12 | 110298497 | THOC4 | 10189 | 0.08 | trans |
Section II. Transcriptome annotation
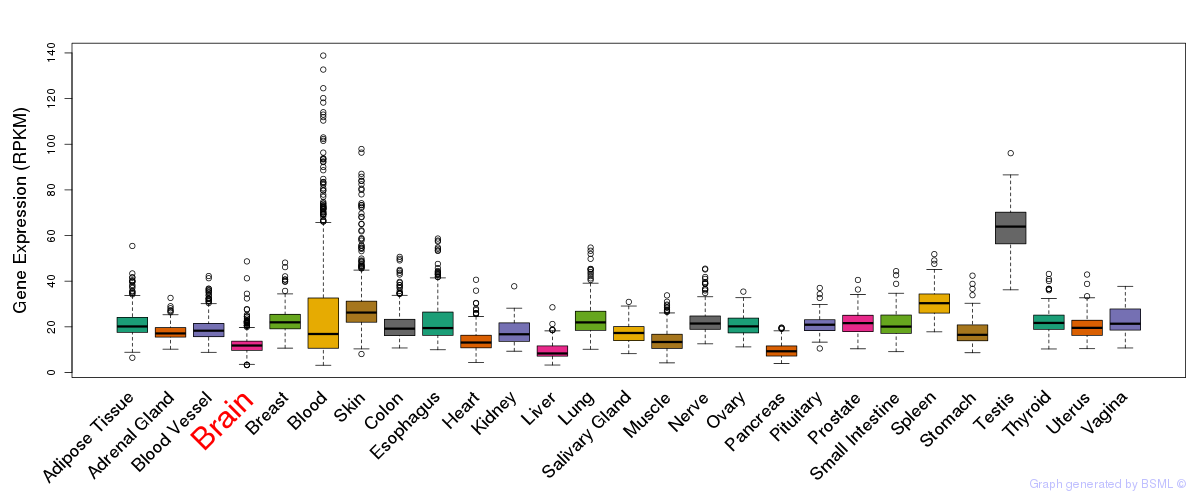
General gene expression (GTEx)
Gene expression during devlopment (BrainCloud)
Footnote:
A total of 269 time points ploted, with n=38 fetal samples (x=1:38). Each triangle represents one time point.
Gene expression of temporal and spatial changes (BrainSpan)
Footnote:
SC: sub-cortical regions; SM: sensory-motor regions; FC: frontal cortex; and TP: temporal-parietal cortex
ST1: fetal (13 - 26 postconception weeks), ST2: early infancy to late childhood (4 months to 11 years), and ST3: adolescence to adulthood (13 - 23 years)
The bar shown representes the lower 25% and upper 25% of the expression distribution.
Top co-expressed genes in brain regions
| Top 10 positively co-expressed genes | ||
| Gene | Pearson's Correlation | Spearman's Correlation |
| SFRS14 | 0.93 | 0.94 |
| AGPAT6 | 0.93 | 0.93 |
| ZNF263 | 0.93 | 0.93 |
| ZNF317 | 0.93 | 0.94 |
| NFX1 | 0.92 | 0.93 |
| KIAA1967 | 0.92 | 0.93 |
| PDCD11 | 0.92 | 0.94 |
| WDR5 | 0.92 | 0.92 |
| BRD9 | 0.92 | 0.93 |
| LSM14B | 0.92 | 0.93 |
| Top 10 negatively co-expressed genes | ||
| Gene | Pearson's Correlation | Spearman's Correlation |
| AF347015.31 | -0.83 | -0.90 |
| MT-CO2 | -0.82 | -0.89 |
| AF347015.33 | -0.80 | -0.87 |
| AF347015.27 | -0.80 | -0.88 |
| AF347015.8 | -0.79 | -0.88 |
| MT-CYB | -0.79 | -0.86 |
| FXYD1 | -0.78 | -0.87 |
| HIGD1B | -0.77 | -0.88 |
| AF347015.15 | -0.76 | -0.86 |
| AF347015.2 | -0.76 | -0.86 |