Gene Page: B3GALT5
Summary ?
| GeneID | 10317 |
| Symbol | B3GALT5 |
| Synonyms | B3GalT-V|B3GalTx|B3T5|GLCT5|beta-1,3-GalTase 5|beta-3-Gx-T5|beta3Gal-T5 |
| Description | Beta-1,3-galactosyltransferase 5 |
| Reference | MIM:604066|HGNC:HGNC:920|Ensembl:ENSG00000183778|HPRD:06818|Vega:OTTHUMG00000086725 |
| Gene type | protein-coding |
| Map location | 21q22.3 |
| Pascal p-value | 0.425 |
| Fetal beta | 0.06 |
Gene in Data Sources
| Gene set name | Method of gene set | Description | Info |
|---|---|---|---|
| CV:GWASdb | Genome-wide Association Studies | GWASdb records for schizophrenia | |
| CV:PGCnp | Genome-wide Association Study | GWAS |
Section I. Genetics and epigenetics annotation
Section II. Transcriptome annotation
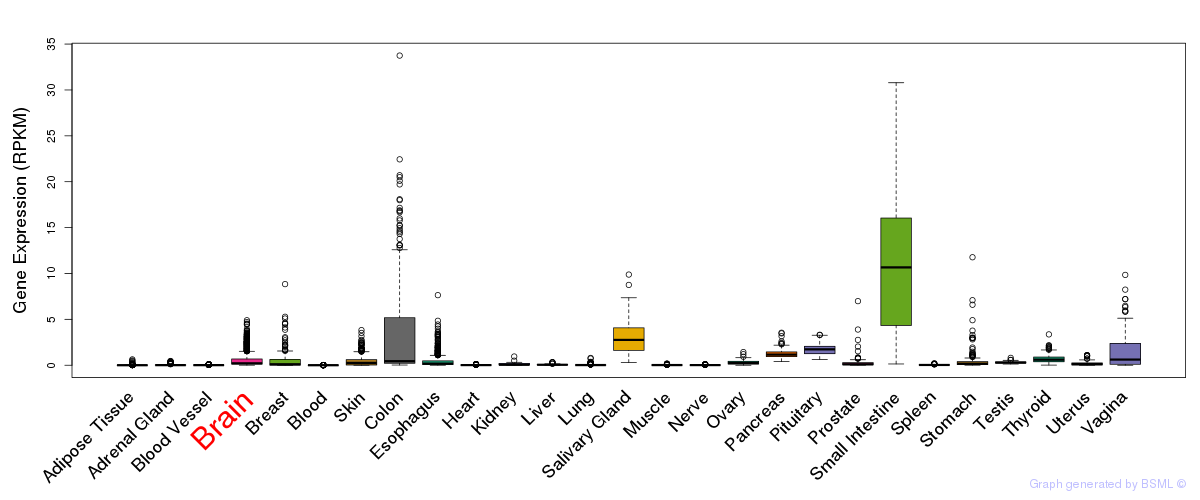
General gene expression (GTEx)
Gene expression during devlopment (BrainCloud)
Footnote:
A total of 269 time points ploted, with n=38 fetal samples (x=1:38). Each triangle represents one time point.
Gene expression of temporal and spatial changes (BrainSpan)
Footnote:
SC: sub-cortical regions; SM: sensory-motor regions; FC: frontal cortex; and TP: temporal-parietal cortex
ST1: fetal (13 - 26 postconception weeks), ST2: early infancy to late childhood (4 months to 11 years), and ST3: adolescence to adulthood (13 - 23 years)
The bar shown representes the lower 25% and upper 25% of the expression distribution.
Top co-expressed genes in brain regions
| Top 10 positively co-expressed genes | ||
| Gene | Pearson's Correlation | Spearman's Correlation |
| SDCCAG10 | 0.94 | 0.90 |
| ZCCHC7 | 0.93 | 0.93 |
| RSL1D1 | 0.93 | 0.93 |
| RBM39 | 0.92 | 0.91 |
| TDRD3 | 0.91 | 0.92 |
| DDX59 | 0.91 | 0.82 |
| SKIV2L2 | 0.91 | 0.89 |
| VRK1 | 0.91 | 0.89 |
| CBX3 | 0.91 | 0.93 |
| NPM1 | 0.90 | 0.86 |
| Top 10 negatively co-expressed genes | ||
| Gene | Pearson's Correlation | Spearman's Correlation |
| HLA-F | -0.59 | -0.79 |
| AF347015.27 | -0.57 | -0.82 |
| AF347015.31 | -0.57 | -0.83 |
| SLC9A3R2 | -0.57 | -0.61 |
| MT-CO2 | -0.57 | -0.84 |
| FBXO2 | -0.56 | -0.70 |
| AF347015.33 | -0.56 | -0.82 |
| TINAGL1 | -0.56 | -0.76 |
| MT-CYB | -0.56 | -0.83 |
| AIFM3 | -0.56 | -0.75 |
Section V. Pathway annotation
| Pathway name | Pathway size | # SZGR 2.0 genes in pathway | Info |
|---|---|---|---|
| KEGG GLYCOSPHINGOLIPID BIOSYNTHESIS LACTO AND NEOLACTO SERIES | 26 | 19 | All SZGR 2.0 genes in this pathway |
| KEGG GLYCOSPHINGOLIPID BIOSYNTHESIS GLOBO SERIES | 14 | 12 | All SZGR 2.0 genes in this pathway |
| PUJANA BRCA1 PCC NETWORK | 1652 | 1023 | All SZGR 2.0 genes in this pathway |
| BROWNE HCMV INFECTION 16HR UP | 225 | 139 | All SZGR 2.0 genes in this pathway |
| LEIN PONS MARKERS | 89 | 59 | All SZGR 2.0 genes in this pathway |
| ACEVEDO LIVER CANCER WITH H3K27ME3 UP | 295 | 149 | All SZGR 2.0 genes in this pathway |
| MIKKELSEN MCV6 HCP WITH H3K27ME3 | 435 | 318 | All SZGR 2.0 genes in this pathway |
| MIKKELSEN MEF HCP WITH H3K27ME3 | 590 | 403 | All SZGR 2.0 genes in this pathway |
| BROWNE HCMV INFECTION 4HR UP | 55 | 41 | All SZGR 2.0 genes in this pathway |
| KIM BIPOLAR DISORDER OLIGODENDROCYTE DENSITY CORR DN | 88 | 59 | All SZGR 2.0 genes in this pathway |
| BRUINS UVC RESPONSE VIA TP53 GROUP A | 898 | 516 | All SZGR 2.0 genes in this pathway |
| FEVR CTNNB1 TARGETS UP | 682 | 433 | All SZGR 2.0 genes in this pathway |