Gene Page: PCGF3
Summary ?
| GeneID | 10336 |
| Symbol | PCGF3 |
| Synonyms | DONG1|RNF3|RNF3A |
| Description | polycomb group ring finger 3 |
| Reference | HGNC:HGNC:10066|Ensembl:ENSG00000185619|HPRD:11515|Vega:OTTHUMG00000119000 |
| Gene type | protein-coding |
| Map location | 4p16.3 |
| Pascal p-value | 0.002 |
| Fetal beta | 0.767 |
| DMG | 1 (# studies) |
| eGene | Cerebellar Hemisphere Cerebellum Frontal Cortex BA9 |
Gene in Data Sources
| Gene set name | Method of gene set | Description | Info |
|---|---|---|---|
| CV:PGCnp | Genome-wide Association Study | GWAS | |
| DMG:Wockner_2014 | Genome-wide DNA methylation analysis | This dataset includes 4641 differentially methylated probes corresponding to 2929 unique genes between schizophrenia patients (n=24) and controls (n=24). | 1 |
Section I. Genetics and epigenetics annotation
 Differentially methylated gene
| Probe | Chromosome | Position | Nearest gene | P (dis) | Beta (dis) | FDR (dis) | Study |
|---|---|---|---|---|---|---|---|
| cg16767590 | 4 | 715950 | PCGF3 | 2.054E-4 | 0.609 | 0.035 | DMG:Wockner_2014 |
Section II. Transcriptome annotation
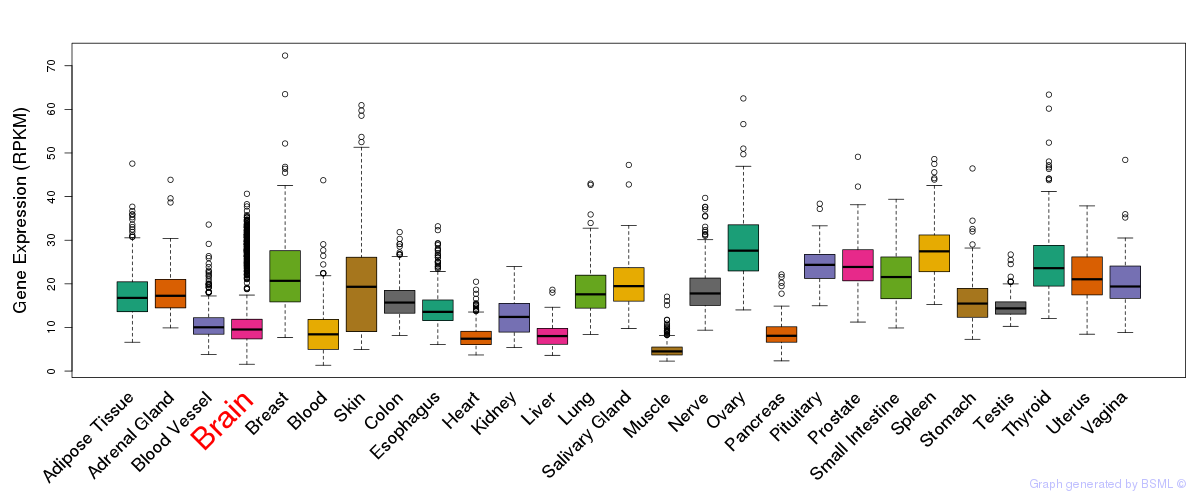
General gene expression (GTEx)
Gene expression during devlopment (BrainCloud)
Footnote:
A total of 269 time points ploted, with n=38 fetal samples (x=1:38). Each triangle represents one time point.
Gene expression of temporal and spatial changes (BrainSpan)
Footnote:
SC: sub-cortical regions; SM: sensory-motor regions; FC: frontal cortex; and TP: temporal-parietal cortex
ST1: fetal (13 - 26 postconception weeks), ST2: early infancy to late childhood (4 months to 11 years), and ST3: adolescence to adulthood (13 - 23 years)
The bar shown representes the lower 25% and upper 25% of the expression distribution.
Top co-expressed genes in brain regions
| Top 10 positively co-expressed genes | ||
| Gene | Pearson's Correlation | Spearman's Correlation |
| TMED10 | 0.90 | 0.89 |
| DDB1 | 0.89 | 0.89 |
| GORASP2 | 0.89 | 0.88 |
| COPA | 0.88 | 0.86 |
| SMU1 | 0.88 | 0.86 |
| P4HB | 0.88 | 0.86 |
| TSN | 0.88 | 0.86 |
| EXD2 | 0.88 | 0.87 |
| GOLPH3 | 0.87 | 0.87 |
| GANAB | 0.87 | 0.86 |
| Top 10 negatively co-expressed genes | ||
| Gene | Pearson's Correlation | Spearman's Correlation |
| MT-CO2 | -0.75 | -0.74 |
| AF347015.21 | -0.75 | -0.74 |
| FXYD1 | -0.71 | -0.71 |
| AF347015.31 | -0.71 | -0.71 |
| AF347015.33 | -0.70 | -0.71 |
| AF347015.8 | -0.70 | -0.71 |
| IFI27 | -0.68 | -0.68 |
| MT-CYB | -0.67 | -0.69 |
| NOSTRIN | -0.67 | -0.62 |
| AC098691.2 | -0.67 | -0.70 |
Section V. Pathway annotation
| Pathway name | Pathway size | # SZGR 2.0 genes in pathway | Info |
|---|---|---|---|
| ONKEN UVEAL MELANOMA UP | 783 | 507 | All SZGR 2.0 genes in this pathway |
| ENK UV RESPONSE KERATINOCYTE DN | 485 | 334 | All SZGR 2.0 genes in this pathway |
| GAUSSMANN MLL AF4 FUSION TARGETS C UP | 170 | 114 | All SZGR 2.0 genes in this pathway |
| LASTOWSKA NEUROBLASTOMA COPY NUMBER DN | 800 | 473 | All SZGR 2.0 genes in this pathway |
| LI WILMS TUMOR ANAPLASTIC UP | 19 | 12 | All SZGR 2.0 genes in this pathway |
| DARWICHE PAPILLOMA RISK HIGH VS LOW UP | 6 | 6 | All SZGR 2.0 genes in this pathway |
| NUYTTEN NIPP1 TARGETS DN | 848 | 527 | All SZGR 2.0 genes in this pathway |
| BROWNE HCMV INFECTION 20HR UP | 240 | 152 | All SZGR 2.0 genes in this pathway |
| BROWNE HCMV INFECTION 16HR UP | 225 | 139 | All SZGR 2.0 genes in this pathway |
| GENTILE UV LOW DOSE UP | 27 | 19 | All SZGR 2.0 genes in this pathway |
| MARIADASON REGULATED BY HISTONE ACETYLATION DN | 54 | 30 | All SZGR 2.0 genes in this pathway |
| BROWNE HCMV INFECTION 48HR UP | 180 | 125 | All SZGR 2.0 genes in this pathway |
| GENTILE UV RESPONSE CLUSTER D2 | 41 | 30 | All SZGR 2.0 genes in this pathway |
| BROWNE HCMV INFECTION 18HR UP | 178 | 111 | All SZGR 2.0 genes in this pathway |
| GENTILE UV HIGH DOSE DN | 312 | 203 | All SZGR 2.0 genes in this pathway |
| BROWNE HCMV INFECTION 24HR UP | 148 | 96 | All SZGR 2.0 genes in this pathway |
| WALLACE PROSTATE CANCER RACE DN | 88 | 42 | All SZGR 2.0 genes in this pathway |
| MCCABE BOUND BY HOXC6 | 469 | 239 | All SZGR 2.0 genes in this pathway |
| BONOME OVARIAN CANCER SURVIVAL SUBOPTIMAL DEBULKING | 510 | 309 | All SZGR 2.0 genes in this pathway |
| LEE DIFFERENTIATING T LYMPHOCYTE | 200 | 115 | All SZGR 2.0 genes in this pathway |
| CHEN METABOLIC SYNDROM NETWORK | 1210 | 725 | All SZGR 2.0 genes in this pathway |
| ZWANG TRANSIENTLY UP BY 1ST EGF PULSE ONLY | 1839 | 928 | All SZGR 2.0 genes in this pathway |