Gene Page: BPNT1
Summary ?
| GeneID | 10380 |
| Symbol | BPNT1 |
| Synonyms | HEL20|PIP |
| Description | 3'(2'), 5'-bisphosphate nucleotidase 1 |
| Reference | MIM:604053|HGNC:HGNC:1096|Ensembl:ENSG00000162813|HPRD:06814|Vega:OTTHUMG00000037435 |
| Gene type | protein-coding |
| Map location | 1q41 |
| Fetal beta | 0.241 |
| DMG | 1 (# studies) |
Gene in Data Sources
| Gene set name | Method of gene set | Description | Info |
|---|---|---|---|
| DMG:Wockner_2014 | Genome-wide DNA methylation analysis | This dataset includes 4641 differentially methylated probes corresponding to 2929 unique genes between schizophrenia patients (n=24) and controls (n=24). | 2 |
| GO_Annotation | Mapping neuro-related keywords to Gene Ontology annotations | Hits with neuro-related keywords: 1 |
Section I. Genetics and epigenetics annotation
 Differentially methylated gene
| Probe | Chromosome | Position | Nearest gene | P (dis) | Beta (dis) | FDR (dis) | Study |
|---|---|---|---|---|---|---|---|
| cg07017209 | 1 | 220263177 | BPNT1 | 1.065E-4 | -0.323 | 0.028 | DMG:Wockner_2014 |
| cg06807791 | 1 | 220232018 | BPNT1 | 3.268E-4 | 0.219 | 0.04 | DMG:Wockner_2014 |
Section II. Transcriptome annotation
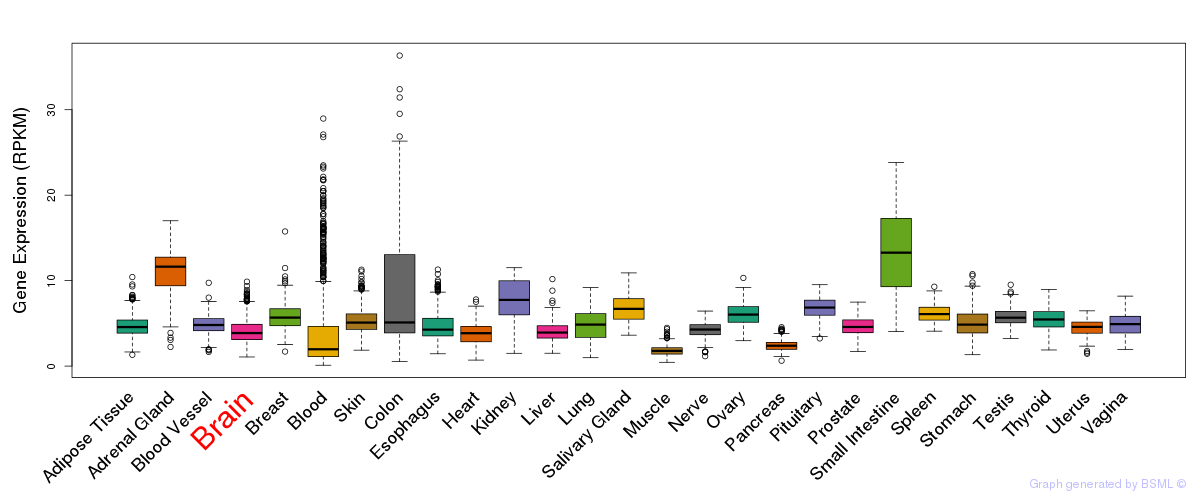
General gene expression (GTEx)
Gene expression during devlopment (BrainCloud)
Footnote:
A total of 269 time points ploted, with n=38 fetal samples (x=1:38). Each triangle represents one time point.
Gene expression of temporal and spatial changes (BrainSpan)
Footnote:
SC: sub-cortical regions; SM: sensory-motor regions; FC: frontal cortex; and TP: temporal-parietal cortex
ST1: fetal (13 - 26 postconception weeks), ST2: early infancy to late childhood (4 months to 11 years), and ST3: adolescence to adulthood (13 - 23 years)
The bar shown representes the lower 25% and upper 25% of the expression distribution.
Top co-expressed genes in brain regions
| Top 10 positively co-expressed genes | ||
| Gene | Pearson's Correlation | Spearman's Correlation |
| CAND1 | 0.97 | 0.98 |
| UBE3A | 0.96 | 0.97 |
| EXOC5 | 0.96 | 0.97 |
| SMEK2 | 0.96 | 0.96 |
| CUL4B | 0.96 | 0.97 |
| ABCE1 | 0.96 | 0.96 |
| CSNK1G3 | 0.96 | 0.97 |
| FYTTD1 | 0.96 | 0.96 |
| KPNA4 | 0.96 | 0.96 |
| NUDT21 | 0.96 | 0.96 |
| Top 10 negatively co-expressed genes | ||
| Gene | Pearson's Correlation | Spearman's Correlation |
| FXYD1 | -0.74 | -0.84 |
| MT-CO2 | -0.73 | -0.83 |
| AF347015.31 | -0.72 | -0.82 |
| IFI27 | -0.71 | -0.82 |
| AC018755.7 | -0.71 | -0.75 |
| HIGD1B | -0.70 | -0.82 |
| AF347015.33 | -0.70 | -0.79 |
| HSD17B14 | -0.70 | -0.77 |
| MT-CYB | -0.69 | -0.79 |
| AF347015.8 | -0.69 | -0.81 |
Section III. Gene Ontology annotation
| Molecular function | GO term | Evidence | Neuro keywords | PubMed ID |
|---|---|---|---|---|
| GO:0000287 | magnesium ion binding | IEA | - | |
| GO:0004437 | inositol or phosphatidylinositol phosphatase activity | IEA | - | |
| GO:0016787 | hydrolase activity | IEA | - | |
| GO:0008441 | 3'(2'),5'-bisphosphate nucleotidase activity | EXP | 10224133 | |
| GO:0008441 | 3'(2'),5'-bisphosphate nucleotidase activity | TAS | 10224133 | |
| GO:0031403 | lithium ion binding | IEA | - | |
| Biological process | GO term | Evidence | Neuro keywords | PubMed ID |
| GO:0007399 | nervous system development | TAS | neurite (GO term level: 5) | 10224133 |
| GO:0006139 | nucleobase, nucleoside, nucleotide and nucleic acid metabolic process | TAS | 10224133 | |
| Cellular component | GO term | Evidence | Neuro keywords | PubMed ID |
| GO:0005829 | cytosol | EXP | 10224133 |
Section V. Pathway annotation
| Pathway name | Pathway size | # SZGR 2.0 genes in pathway | Info |
|---|---|---|---|
| KEGG SULFUR METABOLISM | 13 | 8 | All SZGR 2.0 genes in this pathway |
| SA PTEN PATHWAY | 17 | 14 | All SZGR 2.0 genes in this pathway |
| REACTOME BIOLOGICAL OXIDATIONS | 139 | 91 | All SZGR 2.0 genes in this pathway |
| REACTOME CYTOSOLIC SULFONATION OF SMALL MOLECULES | 14 | 10 | All SZGR 2.0 genes in this pathway |
| REACTOME PHASE II CONJUGATION | 70 | 42 | All SZGR 2.0 genes in this pathway |
| GRAESSMANN APOPTOSIS BY SERUM DEPRIVATION UP | 552 | 347 | All SZGR 2.0 genes in this pathway |
| GRAESSMANN APOPTOSIS BY DOXORUBICIN DN | 1781 | 1082 | All SZGR 2.0 genes in this pathway |
| GRAESSMANN RESPONSE TO MC AND DOXORUBICIN DN | 770 | 415 | All SZGR 2.0 genes in this pathway |
| MCBRYAN PUBERTAL BREAST 4 5WK DN | 196 | 131 | All SZGR 2.0 genes in this pathway |
| MCBRYAN PUBERTAL BREAST 6 7WK UP | 197 | 135 | All SZGR 2.0 genes in this pathway |
| RIZKI TUMOR INVASIVENESS 3D DN | 270 | 181 | All SZGR 2.0 genes in this pathway |
| BOYLAN MULTIPLE MYELOMA C D UP | 139 | 95 | All SZGR 2.0 genes in this pathway |
| YOSHIMURA MAPK8 TARGETS UP | 1305 | 895 | All SZGR 2.0 genes in this pathway |
| CHEN LIVER METABOLISM QTL CIS | 93 | 40 | All SZGR 2.0 genes in this pathway |
Section VI. microRNA annotation
| miRNA family | Target position | miRNA ID | miRNA seq | ||
|---|---|---|---|---|---|
| UTR start | UTR end | Match method | |||
| miR-1/206 | 628 | 634 | m8 | hsa-miR-1 | UGGAAUGUAAAGAAGUAUGUA |
| hsa-miR-206SZ | UGGAAUGUAAGGAAGUGUGUGG | ||||
| hsa-miR-613 | AGGAAUGUUCCUUCUUUGCC | ||||
| miR-409-3p | 627 | 633 | m8 | hsa-miR-409-3p | CGAAUGUUGCUCGGUGAACCCCU |
- SZ: miRNAs which differentially expressed in brain cortex of schizophrenia patients comparing with control samples using microarray. Click here to see the list of SZ related miRNAs.
- Brain: miRNAs which are expressed in brain based on miRNA microarray expression studies. Click here to see the list of brain related miRNAs.