Gene Page: PITRM1
Summary ?
| GeneID | 10531 |
| Symbol | PITRM1 |
| Synonyms | MP1|PreP |
| Description | pitrilysin metallopeptidase 1 |
| Reference | HGNC:HGNC:17663|Ensembl:ENSG00000107959|HPRD:07142|Vega:OTTHUMG00000017557 |
| Gene type | protein-coding |
| Map location | 10p15.2 |
| Pascal p-value | 0.416 |
| DMG | 1 (# studies) |
| eGene | Anterior cingulate cortex BA24 Caudate basal ganglia Cerebellar Hemisphere Cerebellum Cortex Frontal Cortex BA9 Nucleus accumbens basal ganglia Putamen basal ganglia Meta |
Gene in Data Sources
| Gene set name | Method of gene set | Description | Info |
|---|---|---|---|
| CV:PGCnp | Genome-wide Association Study | GWAS | |
| DMG:Wockner_2014 | Genome-wide DNA methylation analysis | This dataset includes 4641 differentially methylated probes corresponding to 2929 unique genes between schizophrenia patients (n=24) and controls (n=24). | 1 |
| DNM:Guipponi_2014 | Whole Exome Sequencing analysis | 49 DNMs were identified by comparing the exome of 53 individuals with sporadic SCZ and of their non-affected parents |
Section I. Genetics and epigenetics annotation
 DNM table
| Gene | Chromosome | Position | Ref | Alt | Transcript | AA change | Mutation type | Sift | CG46 | Trait | Study |
|---|---|---|---|---|---|---|---|---|---|---|---|
| PITRM1 | A | G | NM_001242309 | p.K710R | missense | 0.46 | 0.48 | Schizophrenia | DNM:Guipponi_2014 |
Differentially methylated gene
| Probe | Chromosome | Position | Nearest gene | P (dis) | Beta (dis) | FDR (dis) | Study |
|---|---|---|---|---|---|---|---|
| cg19952014 | 10 | 3186114 | PITRM1 | 4.084E-4 | 0.628 | 0.044 | DMG:Wockner_2014 |
eQTL annotation
| SNP ID | Chromosome | Position | eGene | Gene Entrez ID | pvalue | qvalue | TSS distance | eQTL type |
|---|---|---|---|---|---|---|---|---|
| rs7086721 | 10 | 3163068 | PITRM1 | ENSG00000107959.11 | 1.158E-7 | 0 | 51935 | gtex_brain_ba24 |
| rs139615043 | 10 | 3183044 | PITRM1 | ENSG00000107959.11 | 9.413E-9 | 0 | 31959 | gtex_brain_ba24 |
| rs76088740 | 10 | 3193412 | PITRM1 | ENSG00000107959.11 | 9.64E-9 | 0 | 21591 | gtex_brain_ba24 |
| rs4881121 | 10 | 3220372 | PITRM1 | ENSG00000107959.11 | 8.685E-7 | 0 | -5369 | gtex_brain_ba24 |
| rs4881122 | 10 | 3220859 | PITRM1 | ENSG00000107959.11 | 7.613E-7 | 0 | -5856 | gtex_brain_ba24 |
| rs9423511 | 10 | 3220978 | PITRM1 | ENSG00000107959.11 | 8.702E-7 | 0 | -5975 | gtex_brain_ba24 |
| rs7911657 | 10 | 3161729 | PITRM1 | ENSG00000107959.11 | 5.958E-7 | 0 | 53274 | gtex_brain_putamen_basal |
| rs7898894 | 10 | 3161744 | PITRM1 | ENSG00000107959.11 | 1.144E-7 | 0 | 53259 | gtex_brain_putamen_basal |
| rs61340420 | 10 | 3161797 | PITRM1 | ENSG00000107959.11 | 5.756E-7 | 0 | 53206 | gtex_brain_putamen_basal |
| rs6602026 | 10 | 3162423 | PITRM1 | ENSG00000107959.11 | 3.403E-7 | 0 | 52580 | gtex_brain_putamen_basal |
| rs7086721 | 10 | 3163068 | PITRM1 | ENSG00000107959.11 | 1.224E-8 | 0 | 51935 | gtex_brain_putamen_basal |
| rs9423684 | 10 | 3163512 | PITRM1 | ENSG00000107959.11 | 3.403E-7 | 0 | 51491 | gtex_brain_putamen_basal |
| rs7913100 | 10 | 3164194 | PITRM1 | ENSG00000107959.11 | 3.403E-7 | 0 | 50809 | gtex_brain_putamen_basal |
| rs6602029 | 10 | 3164892 | PITRM1 | ENSG00000107959.11 | 8.525E-7 | 0 | 50111 | gtex_brain_putamen_basal |
| rs3816703 | 10 | 3167465 | PITRM1 | ENSG00000107959.11 | 8.155E-7 | 0 | 47538 | gtex_brain_putamen_basal |
| rs6602031 | 10 | 3167983 | PITRM1 | ENSG00000107959.11 | 6.757E-7 | 0 | 47020 | gtex_brain_putamen_basal |
| rs4881100 | 10 | 3169045 | PITRM1 | ENSG00000107959.11 | 6.757E-7 | 0 | 45958 | gtex_brain_putamen_basal |
| rs4584487 | 10 | 3170256 | PITRM1 | ENSG00000107959.11 | 6.151E-7 | 0 | 44747 | gtex_brain_putamen_basal |
| rs2279205 | 10 | 3170919 | PITRM1 | ENSG00000107959.11 | 6.757E-7 | 0 | 44084 | gtex_brain_putamen_basal |
| rs4611105 | 10 | 3173364 | PITRM1 | ENSG00000107959.11 | 8.078E-7 | 0 | 41639 | gtex_brain_putamen_basal |
| rs9423487 | 10 | 3175088 | PITRM1 | ENSG00000107959.11 | 6.994E-7 | 0 | 39915 | gtex_brain_putamen_basal |
| rs3740612 | 10 | 3175763 | PITRM1 | ENSG00000107959.11 | 6.995E-7 | 0 | 39240 | gtex_brain_putamen_basal |
| rs2306312 | 10 | 3176456 | PITRM1 | ENSG00000107959.11 | 6.995E-7 | 0 | 38547 | gtex_brain_putamen_basal |
| rs3814599 | 10 | 3216153 | PITRM1 | ENSG00000107959.11 | 1.242E-7 | 0 | -1150 | gtex_brain_putamen_basal |
| rs9423505 | 10 | 3218264 | PITRM1 | ENSG00000107959.11 | 1.073E-7 | 0 | -3261 | gtex_brain_putamen_basal |
| rs9423506 | 10 | 3218457 | PITRM1 | ENSG00000107959.11 | 1.073E-7 | 0 | -3454 | gtex_brain_putamen_basal |
| rs4881120 | 10 | 3219399 | PITRM1 | ENSG00000107959.11 | 1.075E-7 | 0 | -4396 | gtex_brain_putamen_basal |
| rs6602036 | 10 | 3219794 | PITRM1 | ENSG00000107959.11 | 1.076E-7 | 0 | -4791 | gtex_brain_putamen_basal |
| rs4881121 | 10 | 3220372 | PITRM1 | ENSG00000107959.11 | 1.078E-7 | 0 | -5369 | gtex_brain_putamen_basal |
| rs4881122 | 10 | 3220859 | PITRM1 | ENSG00000107959.11 | 1.789E-7 | 0 | -5856 | gtex_brain_putamen_basal |
| rs9423511 | 10 | 3220978 | PITRM1 | ENSG00000107959.11 | 1.08E-7 | 0 | -5975 | gtex_brain_putamen_basal |
Section II. Transcriptome annotation
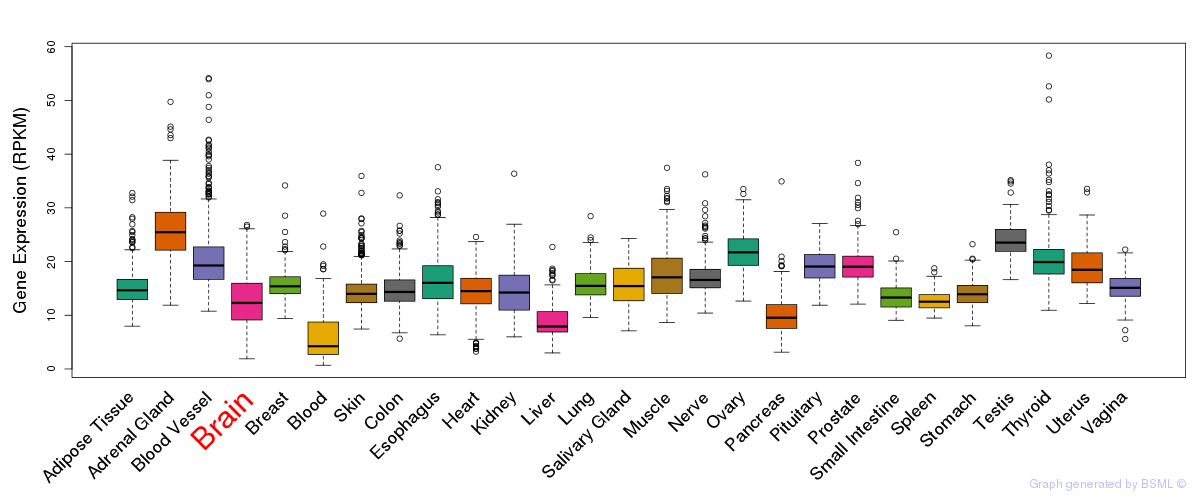
General gene expression (GTEx)
Gene expression of temporal and spatial changes (BrainSpan)
Footnote:
SC: sub-cortical regions; SM: sensory-motor regions; FC: frontal cortex; and TP: temporal-parietal cortex
ST1: fetal (13 - 26 postconception weeks), ST2: early infancy to late childhood (4 months to 11 years), and ST3: adolescence to adulthood (13 - 23 years)
The bar shown representes the lower 25% and upper 25% of the expression distribution.
Top co-expressed genes in brain regions
| Top 10 positively co-expressed genes | ||
| Gene | Pearson's Correlation | Spearman's Correlation |
| ELMOD1 | 0.75 | 0.84 |
| SLC30A4 | 0.71 | 0.79 |
| RIC8B | 0.71 | 0.72 |
| TOMM70A | 0.70 | 0.77 |
| KIAA1468 | 0.70 | 0.83 |
| DOCK4 | 0.69 | 0.75 |
| C9orf41 | 0.68 | 0.75 |
| MCTP1 | 0.68 | 0.73 |
| PTPLB | 0.68 | 0.77 |
| TMEM19 | 0.68 | 0.76 |
| Top 10 negatively co-expressed genes | ||
| Gene | Pearson's Correlation | Spearman's Correlation |
| AP002478.3 | -0.50 | -0.63 |
| FXYD1 | -0.48 | -0.58 |
| RAB34 | -0.48 | -0.62 |
| DBI | -0.48 | -0.60 |
| SLC2A4RG | -0.47 | -0.56 |
| C19orf36 | -0.46 | -0.58 |
| TLCD1 | -0.46 | -0.56 |
| ACSF2 | -0.46 | -0.58 |
| MICA | -0.46 | -0.57 |
| CLDN10 | -0.46 | -0.53 |
Section V. Pathway annotation
| Pathway name | Pathway size | # SZGR 2.0 genes in pathway | Info |
|---|---|---|---|
| ZHONG RESPONSE TO AZACITIDINE AND TSA UP | 183 | 119 | All SZGR 2.0 genes in this pathway |
| DAVICIONI MOLECULAR ARMS VS ERMS UP | 332 | 228 | All SZGR 2.0 genes in this pathway |
| GAUSSMANN MLL AF4 FUSION TARGETS A UP | 191 | 128 | All SZGR 2.0 genes in this pathway |
| VANTVEER BREAST CANCER METASTASIS DN | 121 | 65 | All SZGR 2.0 genes in this pathway |
| WANG TARGETS OF MLL CBP FUSION DN | 45 | 31 | All SZGR 2.0 genes in this pathway |
| IVANOVA HEMATOPOIESIS LATE PROGENITOR | 544 | 307 | All SZGR 2.0 genes in this pathway |
| BLALOCK ALZHEIMERS DISEASE DN | 1237 | 837 | All SZGR 2.0 genes in this pathway |
| JIANG VHL TARGETS | 138 | 91 | All SZGR 2.0 genes in this pathway |
| LIN MELANOMA COPY NUMBER DN | 41 | 34 | All SZGR 2.0 genes in this pathway |
| FOURNIER ACINAR DEVELOPMENT LATE 2 | 277 | 172 | All SZGR 2.0 genes in this pathway |
| VANTVEER BREAST CANCER POOR PROGNOSIS | 55 | 30 | All SZGR 2.0 genes in this pathway |
| LI DCP2 BOUND MRNA | 89 | 57 | All SZGR 2.0 genes in this pathway |
| PILON KLF1 TARGETS UP | 504 | 321 | All SZGR 2.0 genes in this pathway |
| FEVR CTNNB1 TARGETS DN | 553 | 343 | All SZGR 2.0 genes in this pathway |
| BOSCO ALLERGEN INDUCED TH2 ASSOCIATED MODULE | 151 | 86 | All SZGR 2.0 genes in this pathway |