Gene Page: FUT9
Summary ?
| GeneID | 10690 |
| Symbol | FUT9 |
| Synonyms | Fuc-TIX |
| Description | fucosyltransferase 9 (alpha (1,3) fucosyltransferase) |
| Reference | MIM:606865|HGNC:HGNC:4020|Ensembl:ENSG00000172461|HPRD:06036|Vega:OTTHUMG00000015236 |
| Gene type | protein-coding |
| Map location | 6q16 |
| Pascal p-value | 0.001 |
| Fetal beta | 0.463 |
| eGene | Cerebellar Hemisphere Cerebellum |
Gene in Data Sources
| Gene set name | Method of gene set | Description | Info |
|---|---|---|---|
| CV:GWAScat | Genome-wide Association Studies | This data set includes 560 SNPs associated with schizophrenia. A total of 486 genes were mapped to these SNPs within 50kb. | |
| CV:GWASdb | Genome-wide Association Studies | GWASdb records for schizophrenia | |
| CV:PGC128 | Genome-wide Association Study | A multi-stage schizophrenia GWAS of up to 36,989 cases and 113,075 controls. Reported by the Schizophrenia Working Group of PGC. 128 independent associations spanning 108 loci | |
| CV:PGCnp | Genome-wide Association Study | GWAS |
Section I. Genetics and epigenetics annotation
 CV:PGC128
| SNP ID | Chromosome | Position | Allele | P | Function | Gene | Up/Down Distance |
|---|---|---|---|---|---|---|---|
| rs117074560 | chr6 | 96459651 | TC | 1.661E-8 | intergenic | MANEA,FUT9 | dist=402323;dist=4194 |
Section II. Transcriptome annotation
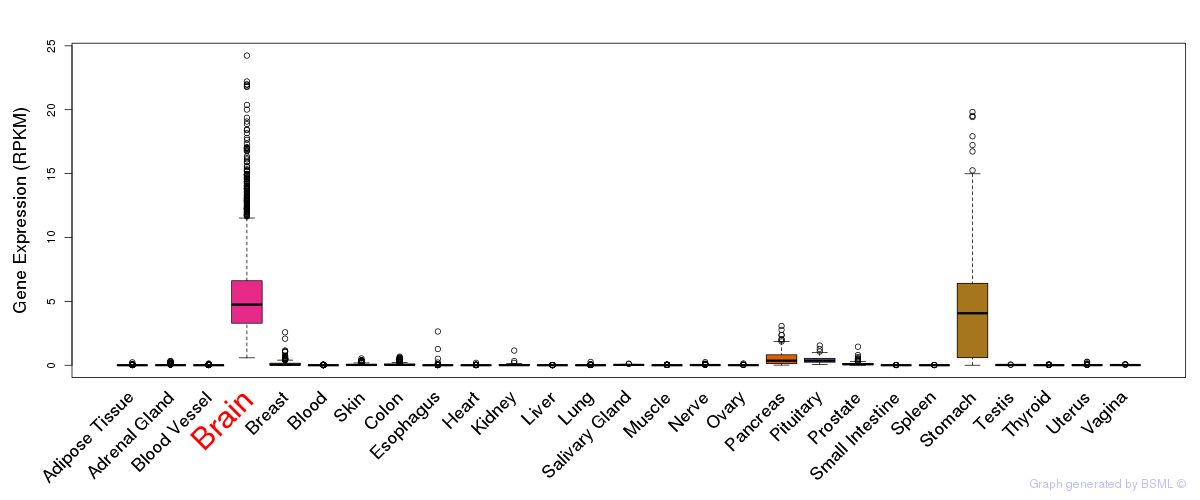
General gene expression (GTEx)
Gene expression during devlopment (BrainCloud)
Footnote:
A total of 269 time points ploted, with n=38 fetal samples (x=1:38). Each triangle represents one time point.
Gene expression of temporal and spatial changes (BrainSpan)
Footnote:
SC: sub-cortical regions; SM: sensory-motor regions; FC: frontal cortex; and TP: temporal-parietal cortex
ST1: fetal (13 - 26 postconception weeks), ST2: early infancy to late childhood (4 months to 11 years), and ST3: adolescence to adulthood (13 - 23 years)
The bar shown representes the lower 25% and upper 25% of the expression distribution.
Top co-expressed genes in brain regions
| Top 10 positively co-expressed genes | ||
| Gene | Pearson's Correlation | Spearman's Correlation |
| FAM38A | 0.78 | 0.75 |
| OPLAH | 0.78 | 0.78 |
| KIF1C | 0.75 | 0.73 |
| GPT | 0.75 | 0.66 |
| GATA2 | 0.74 | 0.69 |
| TRIM56 | 0.73 | 0.76 |
| CASKIN2 | 0.73 | 0.75 |
| RGL3 | 0.73 | 0.65 |
| TBX2 | 0.73 | 0.70 |
| FGFRL1 | 0.73 | 0.76 |
| Top 10 negatively co-expressed genes | ||
| Gene | Pearson's Correlation | Spearman's Correlation |
| TAF9 | -0.64 | -0.63 |
| ACTR10 | -0.62 | -0.57 |
| UBE2D2 | -0.61 | -0.55 |
| VPS29 | -0.61 | -0.62 |
| FARSB | -0.61 | -0.57 |
| GGPS1 | -0.61 | -0.56 |
| FAM92A1 | -0.61 | -0.59 |
| PPP2R3C | -0.61 | -0.65 |
| SPATA7 | -0.60 | -0.57 |
| MTX2 | -0.60 | -0.53 |
Section III. Gene Ontology annotation
| Molecular function | GO term | Evidence | Neuro keywords | PubMed ID |
|---|---|---|---|---|
| GO:0016757 | transferase activity, transferring glycosyl groups | IEA | - | |
| GO:0046920 | alpha(1,3)-fucosyltransferase activity | TAS | 11698403 | |
| Biological process | GO term | Evidence | Neuro keywords | PubMed ID |
| GO:0006486 | protein amino acid glycosylation | TAS | 11698403 | |
| GO:0005975 | carbohydrate metabolic process | TAS | 10386598 | |
| GO:0042355 | L-fucose catabolic process | NAS | 11698403 | |
| Cellular component | GO term | Evidence | Neuro keywords | PubMed ID |
| GO:0005794 | Golgi apparatus | TAS | 11698403 | |
| GO:0016020 | membrane | IEA | - | |
| GO:0016021 | integral to membrane | IEA | - |
Section V. Pathway annotation
| Pathway name | Pathway size | # SZGR 2.0 genes in pathway | Info |
|---|---|---|---|
| KEGG GLYCOSPHINGOLIPID BIOSYNTHESIS LACTO AND NEOLACTO SERIES | 26 | 19 | All SZGR 2.0 genes in this pathway |
| KEGG GLYCOSPHINGOLIPID BIOSYNTHESIS GLOBO SERIES | 14 | 12 | All SZGR 2.0 genes in this pathway |
| VECCHI GASTRIC CANCER EARLY DN | 367 | 220 | All SZGR 2.0 genes in this pathway |
| LEE NEURAL CREST STEM CELL DN | 118 | 79 | All SZGR 2.0 genes in this pathway |
| NAGASHIMA NRG1 SIGNALING DN | 58 | 35 | All SZGR 2.0 genes in this pathway |
| GOZGIT ESR1 TARGETS DN | 781 | 465 | All SZGR 2.0 genes in this pathway |
| SCHAEFFER PROSTATE DEVELOPMENT 48HR UP | 487 | 286 | All SZGR 2.0 genes in this pathway |
| BENPORATH ES WITH H3K27ME3 | 1118 | 744 | All SZGR 2.0 genes in this pathway |
| BROWNE HCMV INFECTION 48HR UP | 180 | 125 | All SZGR 2.0 genes in this pathway |
| BROWNE HCMV INFECTION 6HR UP | 71 | 48 | All SZGR 2.0 genes in this pathway |
| CREIGHTON ENDOCRINE THERAPY RESISTANCE 5 | 482 | 296 | All SZGR 2.0 genes in this pathway |
| ZHANG GATA6 TARGETS UP | 15 | 12 | All SZGR 2.0 genes in this pathway |
| MASSARWEH TAMOXIFEN RESISTANCE UP | 578 | 341 | All SZGR 2.0 genes in this pathway |
| SMID BREAST CANCER BASAL UP | 648 | 398 | All SZGR 2.0 genes in this pathway |
| WAGNER APO2 SENSITIVITY | 25 | 14 | All SZGR 2.0 genes in this pathway |
| SHEDDEN LUNG CANCER POOR SURVIVAL A6 | 456 | 285 | All SZGR 2.0 genes in this pathway |
| BROWNE HCMV INFECTION 1HR UP | 61 | 44 | All SZGR 2.0 genes in this pathway |
| VERHAAK GLIOBLASTOMA NEURAL | 129 | 85 | All SZGR 2.0 genes in this pathway |
| FIGUEROA AML METHYLATION CLUSTER 6 UP | 140 | 81 | All SZGR 2.0 genes in this pathway |
| LEE BMP2 TARGETS UP | 745 | 475 | All SZGR 2.0 genes in this pathway |
| GOBERT OLIGODENDROCYTE DIFFERENTIATION DN | 1080 | 713 | All SZGR 2.0 genes in this pathway |
| RAO BOUND BY SALL4 ISOFORM B | 517 | 302 | All SZGR 2.0 genes in this pathway |
| ACEVEDO FGFR1 TARGETS IN PROSTATE CANCER MODEL DN | 308 | 187 | All SZGR 2.0 genes in this pathway |
Section VI. microRNA annotation
| miRNA family | Target position | miRNA ID | miRNA seq | ||
|---|---|---|---|---|---|
| UTR start | UTR end | Match method | |||
| miR-130/301 | 9247 | 9254 | 1A,m8 | hsa-miR-130abrain | CAGUGCAAUGUUAAAAGGGCAU |
| hsa-miR-301 | CAGUGCAAUAGUAUUGUCAAAGC | ||||
| hsa-miR-130bbrain | CAGUGCAAUGAUGAAAGGGCAU | ||||
| hsa-miR-454-3p | UAGUGCAAUAUUGCUUAUAGGGUUU | ||||
| miR-135 | 10928 | 10934 | m8 | hsa-miR-135a | UAUGGCUUUUUAUUCCUAUGUGA |
| hsa-miR-135b | UAUGGCUUUUCAUUCCUAUGUG | ||||
| miR-182 | 9303 | 9309 | 1A | hsa-miR-182 | UUUGGCAAUGGUAGAACUCACA |
| miR-183 | 8838 | 8844 | 1A | hsa-miR-183 | UAUGGCACUGGUAGAAUUCACUG |
| miR-19 | 9246 | 9252 | m8 | hsa-miR-19a | UGUGCAAAUCUAUGCAAAACUGA |
| hsa-miR-19b | UGUGCAAAUCCAUGCAAAACUGA | ||||
| miR-199 | 11275 | 11281 | 1A | hsa-miR-199a | CCCAGUGUUCAGACUACCUGUUC |
| hsa-miR-199b | CCCAGUGUUUAGACUAUCUGUUC | ||||
| miR-218 | 9433 | 9439 | m8 | hsa-miR-218brain | UUGUGCUUGAUCUAACCAUGU |
| miR-22 | 10905 | 10912 | 1A,m8 | hsa-miR-22brain | AAGCUGCCAGUUGAAGAACUGU |
| miR-23 | 3131 | 3138 | 1A,m8 | hsa-miR-23abrain | AUCACAUUGCCAGGGAUUUCC |
| hsa-miR-23bbrain | AUCACAUUGCCAGGGAUUACC | ||||
| miR-26 | 9529 | 9535 | 1A | hsa-miR-26abrain | UUCAAGUAAUCCAGGAUAGGC |
| hsa-miR-26bSZ | UUCAAGUAAUUCAGGAUAGGUU | ||||
| miR-323 | 3131 | 3137 | 1A | hsa-miR-323brain | GCACAUUACACGGUCGACCUCU |
| miR-34/449 | 9709 | 9716 | 1A,m8 | hsa-miR-34abrain | UGGCAGUGUCUUAGCUGGUUGUU |
| hsa-miR-34c | AGGCAGUGUAGUUAGCUGAUUGC | ||||
| hsa-miR-449 | UGGCAGUGUAUUGUUAGCUGGU | ||||
| hsa-miR-449b | AGGCAGUGUAUUGUUAGCUGGC | ||||
| hsa-miR-34abrain | UGGCAGUGUCUUAGCUGGUUGUU | ||||
| hsa-miR-34c | AGGCAGUGUAGUUAGCUGAUUGC | ||||
| hsa-miR-449 | UGGCAGUGUAUUGUUAGCUGGU | ||||
| hsa-miR-449b | AGGCAGUGUAUUGUUAGCUGGC | ||||
| hsa-miR-34abrain | UGGCAGUGUCUUAGCUGGUUGUU | ||||
| hsa-miR-34c | AGGCAGUGUAGUUAGCUGAUUGC | ||||
| hsa-miR-449 | UGGCAGUGUAUUGUUAGCUGGU | ||||
| hsa-miR-449b | AGGCAGUGUAUUGUUAGCUGGC | ||||
| miR-493-5p | 9309 | 9315 | m8 | hsa-miR-493-5p | UUGUACAUGGUAGGCUUUCAUU |
| miR-96 | 9303 | 9309 | 1A | hsa-miR-96brain | UUUGGCACUAGCACAUUUUUGC |
- SZ: miRNAs which differentially expressed in brain cortex of schizophrenia patients comparing with control samples using microarray. Click here to see the list of SZ related miRNAs.
- Brain: miRNAs which are expressed in brain based on miRNA microarray expression studies. Click here to see the list of brain related miRNAs.