Gene Page: RBBP9
Summary ?
| GeneID | 10741 |
| Symbol | RBBP9 |
| Synonyms | BOG|RBBP10 |
| Description | retinoblastoma binding protein 9 |
| Reference | MIM:602908|HGNC:HGNC:9892|Ensembl:ENSG00000089050|HPRD:04217|Vega:OTTHUMG00000031972 |
| Gene type | protein-coding |
| Map location | 20p11.2 |
| Pascal p-value | 0.649 |
| Sherlock p-value | 0.039 |
| Fetal beta | 1.121 |
| eGene | Cerebellar Hemisphere |
Gene in Data Sources
| Gene set name | Method of gene set | Description | Info |
|---|---|---|---|
| CV:PGCnp | Genome-wide Association Study | GWAS | |
| GSMA_I | Genome scan meta-analysis | Psr: 0.046 |
Section I. Genetics and epigenetics annotation
Section II. Transcriptome annotation
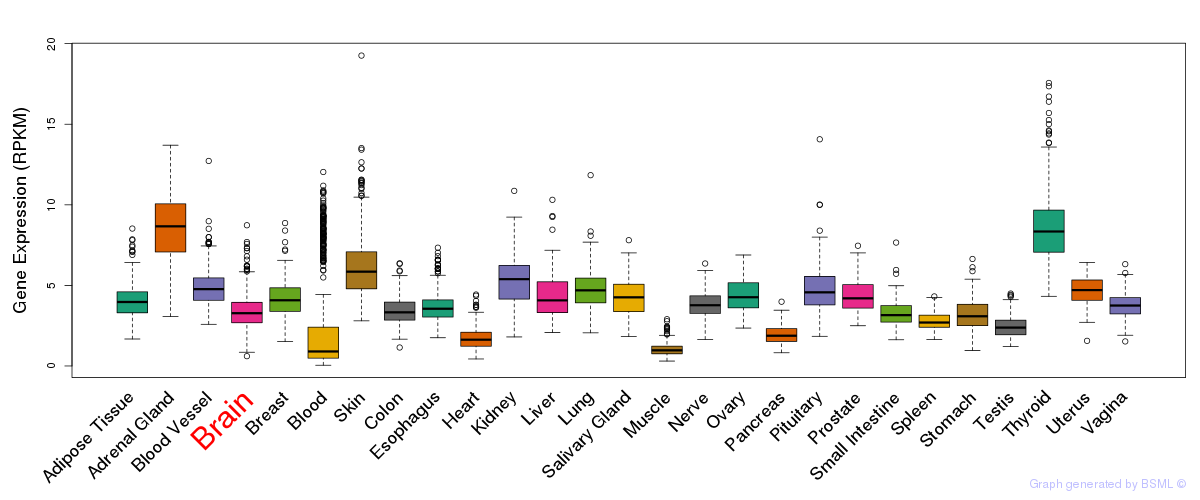
General gene expression (GTEx)
Gene expression during devlopment (BrainCloud)
Footnote:
A total of 269 time points ploted, with n=38 fetal samples (x=1:38). Each triangle represents one time point.
Gene expression of temporal and spatial changes (BrainSpan)
Footnote:
SC: sub-cortical regions; SM: sensory-motor regions; FC: frontal cortex; and TP: temporal-parietal cortex
ST1: fetal (13 - 26 postconception weeks), ST2: early infancy to late childhood (4 months to 11 years), and ST3: adolescence to adulthood (13 - 23 years)
The bar shown representes the lower 25% and upper 25% of the expression distribution.
Top co-expressed genes in brain regions
| Top 10 positively co-expressed genes | ||
| Gene | Pearson's Correlation | Spearman's Correlation |
| MDP1 | 0.90 | 0.81 |
| UQCRQ | 0.89 | 0.80 |
| NDUFB4 | 0.89 | 0.77 |
| MRPL21 | 0.89 | 0.79 |
| DDT | 0.88 | 0.79 |
| HAX1 | 0.88 | 0.79 |
| UCRC | 0.88 | 0.81 |
| MRPL54 | 0.88 | 0.80 |
| C14orf2 | 0.88 | 0.77 |
| MRPS15 | 0.88 | 0.80 |
| Top 10 negatively co-expressed genes | ||
| Gene | Pearson's Correlation | Spearman's Correlation |
| MYH9 | -0.54 | -0.52 |
| MTSS1L | -0.46 | -0.48 |
| BAT2D1 | -0.44 | -0.40 |
| CASKIN2 | -0.43 | -0.49 |
| Z83840.4 | -0.43 | -0.48 |
| MMRN2 | -0.42 | -0.39 |
| CDH5 | -0.41 | -0.43 |
| CCDC55 | -0.40 | -0.39 |
| PDGFRB | -0.40 | -0.44 |
| ZNHIT6 | -0.40 | -0.35 |
Section III. Gene Ontology annotation
| Cellular component | GO term | Evidence | Neuro keywords | PubMed ID |
|---|---|---|---|---|
| GO:0005634 | nucleus | IEA | - | |
| GO:0005737 | cytoplasm | IEA | - |
Section V. Pathway annotation
| Pathway name | Pathway size | # SZGR 2.0 genes in pathway | Info |
|---|---|---|---|
| SENGUPTA NASOPHARYNGEAL CARCINOMA UP | 294 | 178 | All SZGR 2.0 genes in this pathway |
| SENESE HDAC3 TARGETS UP | 501 | 327 | All SZGR 2.0 genes in this pathway |
| DODD NASOPHARYNGEAL CARCINOMA DN | 1375 | 806 | All SZGR 2.0 genes in this pathway |
| MARKEY RB1 ACUTE LOF UP | 215 | 137 | All SZGR 2.0 genes in this pathway |
| GRAESSMANN APOPTOSIS BY SERUM DEPRIVATION UP | 552 | 347 | All SZGR 2.0 genes in this pathway |
| GRAESSMANN APOPTOSIS BY DOXORUBICIN DN | 1781 | 1082 | All SZGR 2.0 genes in this pathway |
| GRAESSMANN RESPONSE TO MC AND DOXORUBICIN DN | 770 | 415 | All SZGR 2.0 genes in this pathway |
| MARTORIATI MDM4 TARGETS FETAL LIVER DN | 514 | 319 | All SZGR 2.0 genes in this pathway |
| WATTEL AUTONOMOUS THYROID ADENOMA UP | 73 | 47 | All SZGR 2.0 genes in this pathway |
| SHETH LIVER CANCER VS TXNIP LOSS PAM4 | 261 | 153 | All SZGR 2.0 genes in this pathway |
| SCHAEFFER PROSTATE DEVELOPMENT 48HR DN | 428 | 306 | All SZGR 2.0 genes in this pathway |
| BENPORATH SOX2 TARGETS | 734 | 436 | All SZGR 2.0 genes in this pathway |
| IVANOVA HEMATOPOIESIS STEM CELL AND PROGENITOR | 681 | 420 | All SZGR 2.0 genes in this pathway |
| VANASSE BCL2 TARGETS DN | 74 | 50 | All SZGR 2.0 genes in this pathway |
| MIKKELSEN ES ICP WITH H3K4ME3 | 718 | 401 | All SZGR 2.0 genes in this pathway |
| MIKKELSEN NPC ICP WITH H3K4ME3 | 445 | 257 | All SZGR 2.0 genes in this pathway |