Gene Page: LILRB1
Summary ?
| GeneID | 10859 |
| Symbol | LILRB1 |
| Synonyms | CD85J|ILT-2|ILT2|LIR-1|LIR1|MIR-7|MIR7 |
| Description | leukocyte immunoglobulin like receptor B1 |
| Reference | MIM:604811|HGNC:HGNC:6605|Ensembl:ENSG00000104972|HPRD:07273|Vega:OTTHUMG00000065695 |
| Gene type | protein-coding |
| Map location | 19q13.4 |
| Pascal p-value | 0.162 |
| Fetal beta | -0.425 |
| DMG | 1 (# studies) |
Gene in Data Sources
| Gene set name | Method of gene set | Description | Info |
|---|---|---|---|
| CV:PGCnp | Genome-wide Association Study | GWAS | |
| DMG:Wockner_2014 | Genome-wide DNA methylation analysis | This dataset includes 4641 differentially methylated probes corresponding to 2929 unique genes between schizophrenia patients (n=24) and controls (n=24). | 1 |
Section I. Genetics and epigenetics annotation
 Differentially methylated gene
| Probe | Chromosome | Position | Nearest gene | P (dis) | Beta (dis) | FDR (dis) | Study |
|---|---|---|---|---|---|---|---|
| cg01720520 | 19 | 55127892 | LILRB1 | 5.431E-4 | -0.272 | 0.048 | DMG:Wockner_2014 |
Section II. Transcriptome annotation
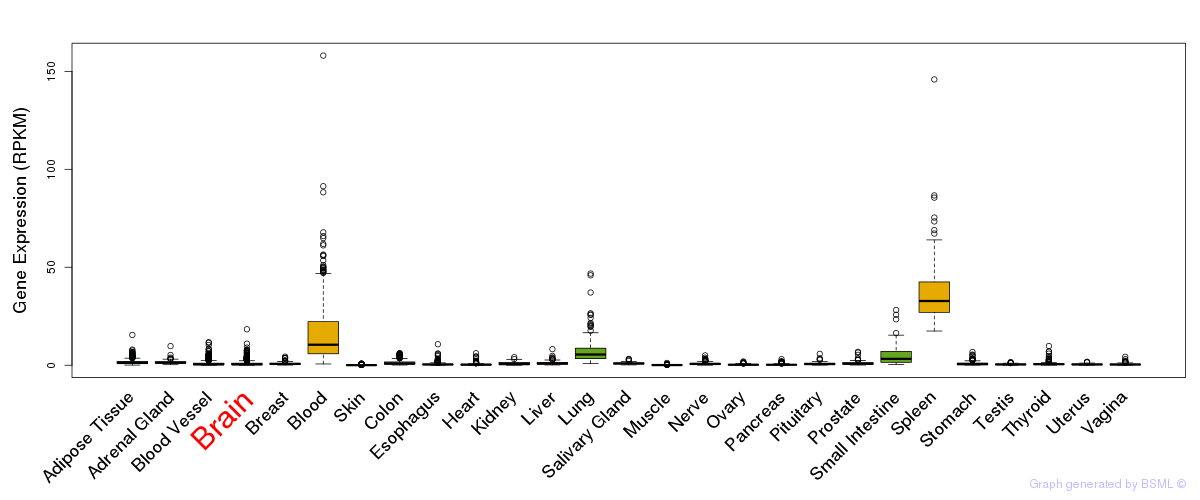
General gene expression (GTEx)
Gene expression during devlopment (BrainCloud)
Footnote:
A total of 269 time points ploted, with n=38 fetal samples (x=1:38). Each triangle represents one time point.
Gene expression of temporal and spatial changes (BrainSpan)
Footnote:
SC: sub-cortical regions; SM: sensory-motor regions; FC: frontal cortex; and TP: temporal-parietal cortex
ST1: fetal (13 - 26 postconception weeks), ST2: early infancy to late childhood (4 months to 11 years), and ST3: adolescence to adulthood (13 - 23 years)
The bar shown representes the lower 25% and upper 25% of the expression distribution.
Top co-expressed genes in brain regions
| Top 10 positively co-expressed genes | ||
| Gene | Pearson's Correlation | Spearman's Correlation |
| COPZ1 | 0.89 | 0.86 |
| MRPL3 | 0.88 | 0.87 |
| RAN | 0.88 | 0.84 |
| TAF7 | 0.87 | 0.87 |
| PTGES3 | 0.87 | 0.85 |
| PSMD6 | 0.87 | 0.83 |
| FAF1 | 0.87 | 0.84 |
| FBXO22 | 0.87 | 0.83 |
| ATG12 | 0.86 | 0.85 |
| RAD1 | 0.86 | 0.83 |
| Top 10 negatively co-expressed genes | ||
| Gene | Pearson's Correlation | Spearman's Correlation |
| AF347015.8 | -0.79 | -0.77 |
| MT-CO2 | -0.77 | -0.75 |
| AF347015.15 | -0.76 | -0.77 |
| AF347015.2 | -0.75 | -0.73 |
| AF347015.33 | -0.75 | -0.74 |
| MT-CYB | -0.75 | -0.75 |
| AF347015.27 | -0.74 | -0.75 |
| AF347015.26 | -0.73 | -0.73 |
| AF347015.31 | -0.72 | -0.72 |
| AF347015.21 | -0.72 | -0.70 |
Section V. Pathway annotation
| Pathway name | Pathway size | # SZGR 2.0 genes in pathway | Info |
|---|---|---|---|
| REACTOME IMMUNOREGULATORY INTERACTIONS BETWEEN A LYMPHOID AND A NON LYMPHOID CELL | 70 | 37 | All SZGR 2.0 genes in this pathway |
| REACTOME IMMUNE SYSTEM | 933 | 616 | All SZGR 2.0 genes in this pathway |
| REACTOME ADAPTIVE IMMUNE SYSTEM | 539 | 350 | All SZGR 2.0 genes in this pathway |
| THUM SYSTOLIC HEART FAILURE UP | 423 | 283 | All SZGR 2.0 genes in this pathway |
| GAL LEUKEMIC STEM CELL DN | 244 | 153 | All SZGR 2.0 genes in this pathway |
| OSMAN BLADDER CANCER UP | 404 | 246 | All SZGR 2.0 genes in this pathway |
| TONKS TARGETS OF RUNX1 RUNX1T1 FUSION ERYTHROCYTE UP | 157 | 104 | All SZGR 2.0 genes in this pathway |
| MATTIOLI MGUS VS PCL | 116 | 62 | All SZGR 2.0 genes in this pathway |
| SPIELMAN LYMPHOBLAST EUROPEAN VS ASIAN DN | 584 | 395 | All SZGR 2.0 genes in this pathway |
| VERHAAK AML WITH NPM1 MUTATED UP | 183 | 111 | All SZGR 2.0 genes in this pathway |
| CROMER TUMORIGENESIS DN | 51 | 29 | All SZGR 2.0 genes in this pathway |
| DAVIES MULTIPLE MYELOMA VS MGUS DN | 28 | 18 | All SZGR 2.0 genes in this pathway |
| VALK AML CLUSTER 5 | 33 | 24 | All SZGR 2.0 genes in this pathway |
| POOLA INVASIVE BREAST CANCER UP | 288 | 168 | All SZGR 2.0 genes in this pathway |
| NAKAYAMA SOFT TISSUE TUMORS PCA1 UP | 76 | 46 | All SZGR 2.0 genes in this pathway |
| BOSCO INTERFERON INDUCED ANTIVIRAL MODULE | 78 | 48 | All SZGR 2.0 genes in this pathway |
| KUMAR PATHOGEN LOAD BY MACROPHAGES | 275 | 155 | All SZGR 2.0 genes in this pathway |