Gene Page: FASTK
Summary ?
| GeneID | 10922 |
| Symbol | FASTK |
| Synonyms | FAST |
| Description | Fas activated serine/threonine kinase |
| Reference | MIM:606965|HGNC:HGNC:24676|Ensembl:ENSG00000164896|HPRD:07368|Vega:OTTHUMG00000158694 |
| Gene type | protein-coding |
| Map location | 7q35 |
| Pascal p-value | 5.973E-4 |
| Sherlock p-value | 0.12 |
| Fetal beta | -0.547 |
| DMG | 1 (# studies) |
| eGene | Anterior cingulate cortex BA24 |
Gene in Data Sources
| Gene set name | Method of gene set | Description | Info |
|---|---|---|---|
| CV:PGCnp | Genome-wide Association Study | GWAS | |
| DMG:Nishioka_2013 | Genome-wide DNA methylation analysis | The authors investigated the methylation profiles of DNA in peripheral blood cells from 18 patients with first-episode schizophrenia (FESZ) and from 15 normal controls. | 1 |
Section I. Genetics and epigenetics annotation
 Differentially methylated gene
| Probe | Chromosome | Position | Nearest gene | P (dis) | Beta (dis) | FDR (dis) | Study |
|---|---|---|---|---|---|---|---|
| cg26975609 | 7 | 150777587 | FASTK | -0.037 | 0.85 | DMG:Nishioka_2013 |
eQTL annotation
| SNP ID | Chromosome | Position | eGene | Gene Entrez ID | pvalue | qvalue | TSS distance | eQTL type |
|---|---|---|---|---|---|---|---|---|
| rs62502607 | 7 | 149851574 | FASTK | ENSG00000164896.15 | 2.24479E-6 | 0.05 | 926375 | gtex_brain_ba24 |
Section II. Transcriptome annotation
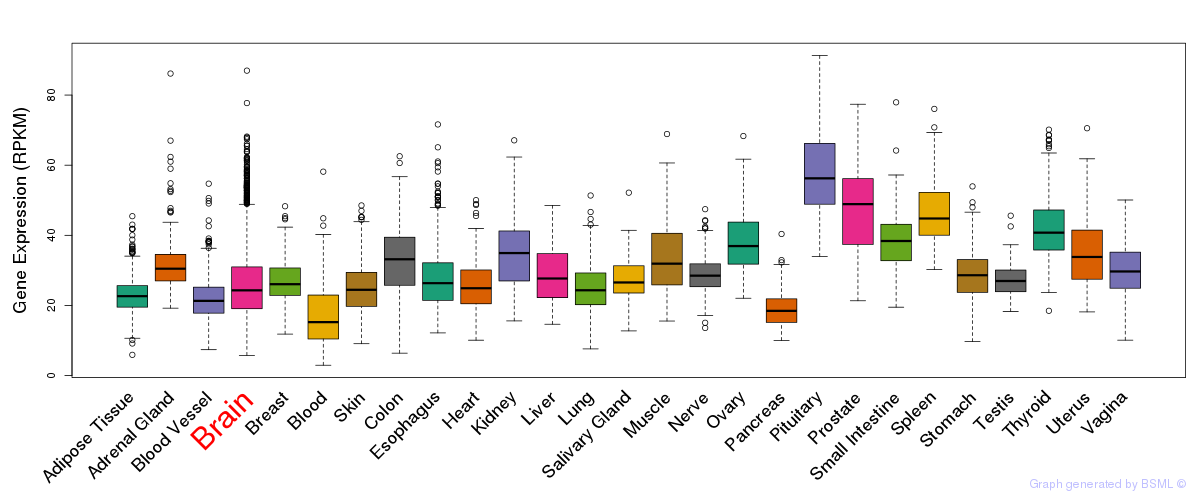
General gene expression (GTEx)
Gene expression during devlopment (BrainCloud)
Footnote:
A total of 269 time points ploted, with n=38 fetal samples (x=1:38). Each triangle represents one time point.
Gene expression of temporal and spatial changes (BrainSpan)
Footnote:
SC: sub-cortical regions; SM: sensory-motor regions; FC: frontal cortex; and TP: temporal-parietal cortex
ST1: fetal (13 - 26 postconception weeks), ST2: early infancy to late childhood (4 months to 11 years), and ST3: adolescence to adulthood (13 - 23 years)
The bar shown representes the lower 25% and upper 25% of the expression distribution.
Top co-expressed genes in brain regions
| Top 10 positively co-expressed genes | ||
| Gene | Pearson's Correlation | Spearman's Correlation |
| HSPH1 | 0.86 | 0.80 |
| DNAJA4 | 0.78 | 0.80 |
| PPP4R4 | 0.78 | 0.75 |
| BLZF1 | 0.77 | 0.80 |
| KIAA1279 | 0.77 | 0.78 |
| TPMT | 0.77 | 0.87 |
| IDH3A | 0.76 | 0.88 |
| KRT222P | 0.76 | 0.83 |
| SETD3 | 0.76 | 0.84 |
| ARL1 | 0.75 | 0.89 |
| Top 10 negatively co-expressed genes | ||
| Gene | Pearson's Correlation | Spearman's Correlation |
| HYAL2 | -0.46 | -0.53 |
| BCL7C | -0.45 | -0.62 |
| SLC38A5 | -0.45 | -0.52 |
| RAMP2 | -0.45 | -0.55 |
| SIGIRR | -0.44 | -0.56 |
| SLC16A13 | -0.44 | -0.51 |
| SH3BP2 | -0.44 | -0.53 |
| NME4 | -0.43 | -0.60 |
| SH2D2A | -0.42 | -0.52 |
| MYLK2 | -0.42 | -0.44 |
Section V. Pathway annotation
| Pathway name | Pathway size | # SZGR 2.0 genes in pathway | Info |
|---|---|---|---|
| GRAESSMANN APOPTOSIS BY DOXORUBICIN DN | 1781 | 1082 | All SZGR 2.0 genes in this pathway |
| RASHI RESPONSE TO IONIZING RADIATION 5 | 147 | 89 | All SZGR 2.0 genes in this pathway |
| PATIL LIVER CANCER | 747 | 453 | All SZGR 2.0 genes in this pathway |
| LOPEZ MBD TARGETS | 957 | 597 | All SZGR 2.0 genes in this pathway |
| LOCKWOOD AMPLIFIED IN LUNG CANCER | 214 | 139 | All SZGR 2.0 genes in this pathway |
| BYSTRYKH HEMATOPOIESIS STEM CELL QTL TRANS | 882 | 572 | All SZGR 2.0 genes in this pathway |
| LEI MYB TARGETS | 318 | 215 | All SZGR 2.0 genes in this pathway |
| CHIBA RESPONSE TO TSA UP | 52 | 33 | All SZGR 2.0 genes in this pathway |
| HU GENOTOXIN ACTION DIRECT VS INDIRECT 24HR | 55 | 38 | All SZGR 2.0 genes in this pathway |
| WEIGEL OXIDATIVE STRESS BY HNE AND TBH | 60 | 42 | All SZGR 2.0 genes in this pathway |
| LEE METASTASIS AND ALTERNATIVE SPLICING UP | 74 | 51 | All SZGR 2.0 genes in this pathway |
| MOOTHA PGC | 420 | 269 | All SZGR 2.0 genes in this pathway |
| IVANOVSKA MIR106B TARGETS | 90 | 56 | All SZGR 2.0 genes in this pathway |
| LINSLEY MIR16 TARGETS | 206 | 127 | All SZGR 2.0 genes in this pathway |
| KOINUMA TARGETS OF SMAD2 OR SMAD3 | 824 | 528 | All SZGR 2.0 genes in this pathway |
| FOSTER KDM1A TARGETS DN | 211 | 119 | All SZGR 2.0 genes in this pathway |