Gene Page: ASCC3
Summary ?
| GeneID | 10973 |
| Symbol | ASCC3 |
| Synonyms | ASC1p200|HELIC1|RNAH |
| Description | activating signal cointegrator 1 complex subunit 3 |
| Reference | MIM:614217|HGNC:HGNC:18697|Ensembl:ENSG00000112249|HPRD:09980|HPRD:16805|Vega:OTTHUMG00000015279 |
| Gene type | protein-coding |
| Map location | 6q16 |
| Pascal p-value | 0.107 |
| Sherlock p-value | 0.501 |
| Fetal beta | 0.091 |
| DMG | 2 (# studies) |
| eGene | Cortex |
Gene in Data Sources
| Gene set name | Method of gene set | Description | Info |
|---|---|---|---|
| CV:PGCnp | Genome-wide Association Study | GWAS | |
| DMG:Jaffe_2016 | Genome-wide DNA methylation analysis | This dataset includes 2,104 probes/CpGs associated with SZ patients (n=108) compared to 136 controls at Bonferroni-adjusted P < 0.05. | 2 |
| DMG:Nishioka_2013 | Genome-wide DNA methylation analysis | The authors investigated the methylation profiles of DNA in peripheral blood cells from 18 patients with first-episode schizophrenia (FESZ) and from 15 normal controls. | 2 |
Section I. Genetics and epigenetics annotation
 Differentially methylated gene
| Probe | Chromosome | Position | Nearest gene | P (dis) | Beta (dis) | FDR (dis) | Study |
|---|---|---|---|---|---|---|---|
| cg03664139 | 6 | 101329504 | ASCC3 | -0.032 | 0.38 | DMG:Nishioka_2013 | |
| cg03664139 | 6 | 101329504 | ASCC3 | 1.86E-9 | -0.023 | 1.58E-6 | DMG:Jaffe_2016 |
Section II. Transcriptome annotation
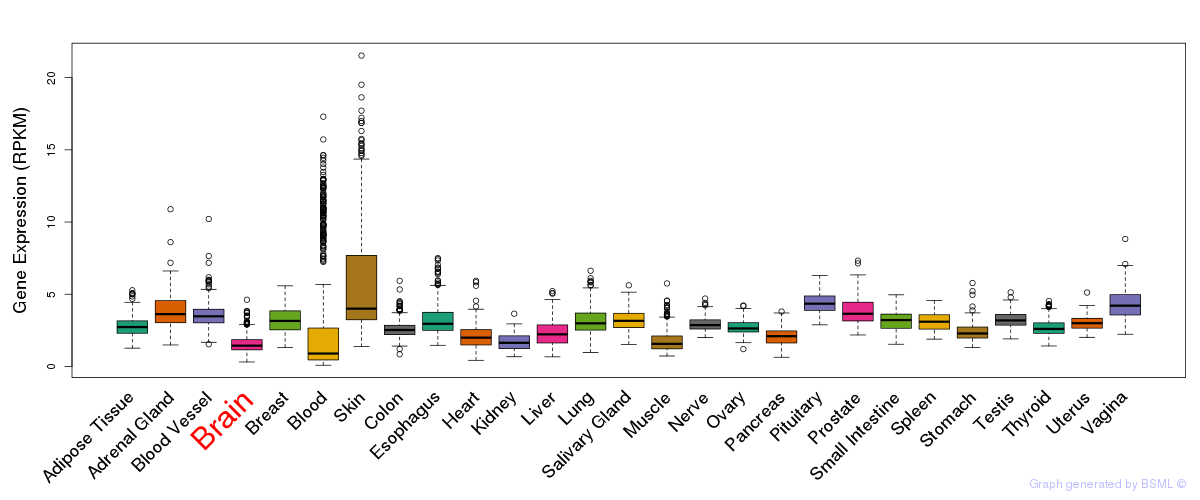
General gene expression (GTEx)
Gene expression during devlopment (BrainCloud)
Footnote:
A total of 269 time points ploted, with n=38 fetal samples (x=1:38). Each triangle represents one time point.
Gene expression of temporal and spatial changes (BrainSpan)
Footnote:
SC: sub-cortical regions; SM: sensory-motor regions; FC: frontal cortex; and TP: temporal-parietal cortex
ST1: fetal (13 - 26 postconception weeks), ST2: early infancy to late childhood (4 months to 11 years), and ST3: adolescence to adulthood (13 - 23 years)
The bar shown representes the lower 25% and upper 25% of the expression distribution.
Top co-expressed genes in brain regions
| Top 10 positively co-expressed genes | ||
| Gene | Pearson's Correlation | Spearman's Correlation |
| ZNF513 | 0.95 | 0.95 |
| TRABD | 0.93 | 0.91 |
| CPSF3L | 0.93 | 0.93 |
| SPIRE2 | 0.92 | 0.93 |
| ZNF446 | 0.92 | 0.93 |
| ARRDC1 | 0.92 | 0.91 |
| B4GALNT4 | 0.92 | 0.92 |
| ZNF517 | 0.92 | 0.93 |
| GTPBP3 | 0.92 | 0.92 |
| LRRC45 | 0.91 | 0.92 |
| Top 10 negatively co-expressed genes | ||
| Gene | Pearson's Correlation | Spearman's Correlation |
| AF347015.27 | -0.71 | -0.80 |
| AF347015.31 | -0.70 | -0.78 |
| MT-CO2 | -0.68 | -0.77 |
| AF347015.33 | -0.67 | -0.76 |
| AF347015.8 | -0.67 | -0.78 |
| MT-CYB | -0.66 | -0.76 |
| C5orf53 | -0.64 | -0.66 |
| AF347015.21 | -0.64 | -0.80 |
| AF347015.15 | -0.64 | -0.75 |
| COPZ2 | -0.62 | -0.70 |
Section V. Pathway annotation
| Pathway name | Pathway size | # SZGR 2.0 genes in pathway | Info |
|---|---|---|---|
| SENGUPTA NASOPHARYNGEAL CARCINOMA UP | 294 | 178 | All SZGR 2.0 genes in this pathway |
| DAVICIONI MOLECULAR ARMS VS ERMS UP | 332 | 228 | All SZGR 2.0 genes in this pathway |
| GARY CD5 TARGETS DN | 431 | 263 | All SZGR 2.0 genes in this pathway |
| KIM WT1 TARGETS DN | 459 | 276 | All SZGR 2.0 genes in this pathway |
| DODD NASOPHARYNGEAL CARCINOMA DN | 1375 | 806 | All SZGR 2.0 genes in this pathway |
| RODRIGUES THYROID CARCINOMA ANAPLASTIC UP | 722 | 443 | All SZGR 2.0 genes in this pathway |
| DACOSTA UV RESPONSE VIA ERCC3 DN | 855 | 609 | All SZGR 2.0 genes in this pathway |
| DACOSTA UV RESPONSE VIA ERCC3 COMMON DN | 483 | 336 | All SZGR 2.0 genes in this pathway |
| WEI MYCN TARGETS WITH E BOX | 795 | 478 | All SZGR 2.0 genes in this pathway |
| RICKMAN TUMOR DIFFERENTIATED WELL VS MODERATELY DN | 110 | 64 | All SZGR 2.0 genes in this pathway |
| JAIN NFKB SIGNALING | 75 | 44 | All SZGR 2.0 genes in this pathway |
| FRASOR RESPONSE TO SERM OR FULVESTRANT UP | 24 | 14 | All SZGR 2.0 genes in this pathway |
| LU EZH2 TARGETS DN | 414 | 237 | All SZGR 2.0 genes in this pathway |
| YANG BCL3 TARGETS UP | 364 | 236 | All SZGR 2.0 genes in this pathway |
| GHANDHI DIRECT IRRADIATION UP | 110 | 68 | All SZGR 2.0 genes in this pathway |