Gene Page: ATF7
Summary ?
| GeneID | 11016 |
| Symbol | ATF7 |
| Synonyms | ATFA |
| Description | activating transcription factor 7 |
| Reference | MIM:606371|HGNC:HGNC:792|Ensembl:ENSG00000170653|HPRD:06968|Vega:OTTHUMG00000169776 |
| Gene type | protein-coding |
| Map location | 12q13 |
| Pascal p-value | 0.058 |
| DEG p-value | DEG:Zhao_2015:p=4.16e-04:q=0.0926 |
| Fetal beta | 0.642 |
Gene in Data Sources
| Gene set name | Method of gene set | Description | Info |
|---|---|---|---|
| CV:GWASdb | Genome-wide Association Studies | GWASdb records for schizophrenia | |
| CV:PGCnp | Genome-wide Association Study | GWAS | |
| DEG:Zhao_2015 | RNA Sequencing analysis | Transcriptome sequencing and genome-wide association analyses reveal lysosomal function and actin cytoskeleton remodeling in schizophrenia and bipolar disorder. |
Section I. Genetics and epigenetics annotation
Section II. Transcriptome annotation
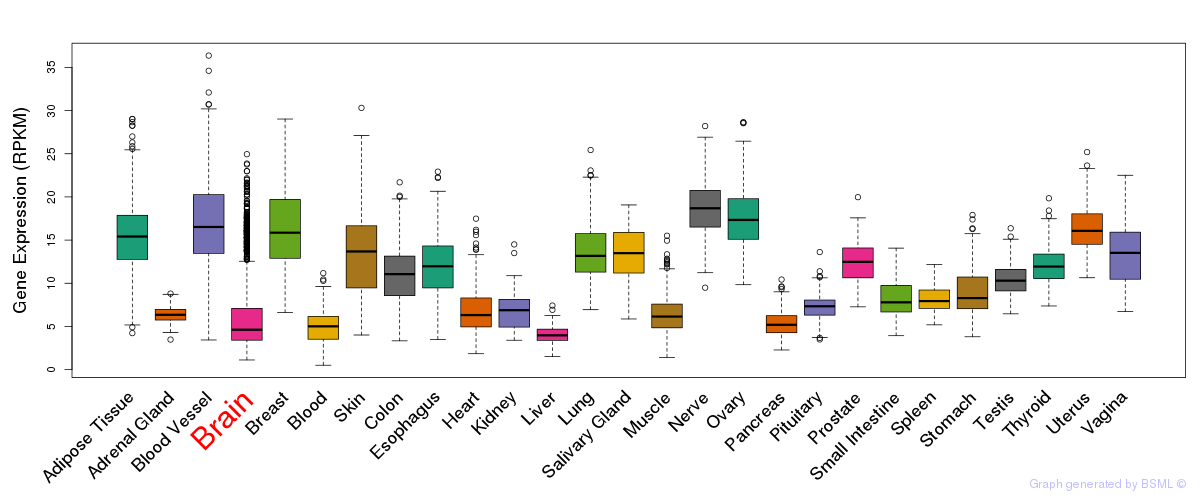
General gene expression (GTEx)
Gene expression during devlopment (BrainCloud)
Footnote:
A total of 269 time points ploted, with n=38 fetal samples (x=1:38). Each triangle represents one time point.
Gene expression of temporal and spatial changes (BrainSpan)
Footnote:
SC: sub-cortical regions; SM: sensory-motor regions; FC: frontal cortex; and TP: temporal-parietal cortex
ST1: fetal (13 - 26 postconception weeks), ST2: early infancy to late childhood (4 months to 11 years), and ST3: adolescence to adulthood (13 - 23 years)
The bar shown representes the lower 25% and upper 25% of the expression distribution.
Top co-expressed genes in brain regions
| Top 10 positively co-expressed genes | ||
| Gene | Pearson's Correlation | Spearman's Correlation |
| C2CD3 | 0.96 | 0.95 |
| RAD54L2 | 0.95 | 0.96 |
| EP300 | 0.95 | 0.95 |
| ZBTB40 | 0.95 | 0.96 |
| CRKRS | 0.95 | 0.95 |
| GATAD2B | 0.94 | 0.94 |
| ZZEF1 | 0.94 | 0.96 |
| TRRAP | 0.94 | 0.95 |
| ZNF609 | 0.94 | 0.94 |
| HUWE1 | 0.94 | 0.95 |
| Top 10 negatively co-expressed genes | ||
| Gene | Pearson's Correlation | Spearman's Correlation |
| AF347015.31 | -0.68 | -0.81 |
| IFI27 | -0.67 | -0.78 |
| HIGD1B | -0.66 | -0.81 |
| MT-CO2 | -0.65 | -0.79 |
| S100A16 | -0.65 | -0.76 |
| C5orf53 | -0.65 | -0.69 |
| AF347015.21 | -0.65 | -0.87 |
| FXYD1 | -0.65 | -0.77 |
| AF347015.27 | -0.64 | -0.77 |
| SERPINB6 | -0.64 | -0.67 |
Section V. Pathway annotation
| Pathway name | Pathway size | # SZGR 2.0 genes in pathway | Info |
|---|---|---|---|
| PID RB 1PATHWAY | 65 | 46 | All SZGR 2.0 genes in this pathway |
| KINSEY TARGETS OF EWSR1 FLII FUSION UP | 1278 | 748 | All SZGR 2.0 genes in this pathway |
| BENPORATH MYC TARGETS WITH EBOX | 230 | 156 | All SZGR 2.0 genes in this pathway |
| KYNG DNA DAMAGE BY 4NQO | 38 | 24 | All SZGR 2.0 genes in this pathway |
| KYNG DNA DAMAGE UP | 226 | 164 | All SZGR 2.0 genes in this pathway |
| DANG BOUND BY MYC | 1103 | 714 | All SZGR 2.0 genes in this pathway |
| BROWNE HCMV INFECTION 1HR DN | 222 | 147 | All SZGR 2.0 genes in this pathway |
| WANG RESPONSE TO GSK3 INHIBITOR SB216763 UP | 397 | 206 | All SZGR 2.0 genes in this pathway |
| ALFANO MYC TARGETS | 239 | 156 | All SZGR 2.0 genes in this pathway |