Gene Page: IFT27
Summary ?
| GeneID | 11020 |
| Symbol | IFT27 |
| Synonyms | BBS19|RABL4|RAYL |
| Description | intraflagellar transport 27 |
| Reference | MIM:615870|HGNC:HGNC:18626|Ensembl:ENSG00000100360|Vega:OTTHUMG00000150544 |
| Gene type | protein-coding |
| Map location | 22q13.1 |
| Pascal p-value | 0.008 |
| Sherlock p-value | 0.717 |
| Fetal beta | -0.783 |
| eGene | Caudate basal ganglia Cortex Frontal Cortex BA9 Nucleus accumbens basal ganglia Putamen basal ganglia Meta |
Gene in Data Sources
| Gene set name | Method of gene set | Description | Info |
|---|---|---|---|
| CV:GWASdb | Genome-wide Association Studies | GWASdb records for schizophrenia | |
| CV:PGCnp | Genome-wide Association Study | GWAS |
Section I. Genetics and epigenetics annotation
 eQTL annotation
| SNP ID | Chromosome | Position | eGene | Gene Entrez ID | pvalue | qvalue | TSS distance | eQTL type |
|---|---|---|---|---|---|---|---|---|
| rs3827351 | 22 | 37157240 | IFT27 | ENSG00000100360.10 | 8.50745E-7 | 0.01 | 15060 | gtex_brain_putamen_basal |
| rs1048015 | 22 | 37163080 | IFT27 | ENSG00000100360.10 | 2.96297E-6 | 0.01 | 9220 | gtex_brain_putamen_basal |
| rs5750306 | 22 | 37170915 | IFT27 | ENSG00000100360.10 | 1.0358E-6 | 0.01 | 1385 | gtex_brain_putamen_basal |
| rs5750307 | 22 | 37170977 | IFT27 | ENSG00000100360.10 | 1.0358E-6 | 0.01 | 1323 | gtex_brain_putamen_basal |
| rs8135284 | 22 | 37182681 | IFT27 | ENSG00000100360.10 | 1.9563E-6 | 0.01 | -10381 | gtex_brain_putamen_basal |
| rs9607382 | 22 | 37191418 | IFT27 | ENSG00000100360.10 | 3.33923E-6 | 0.01 | -19118 | gtex_brain_putamen_basal |
Section II. Transcriptome annotation
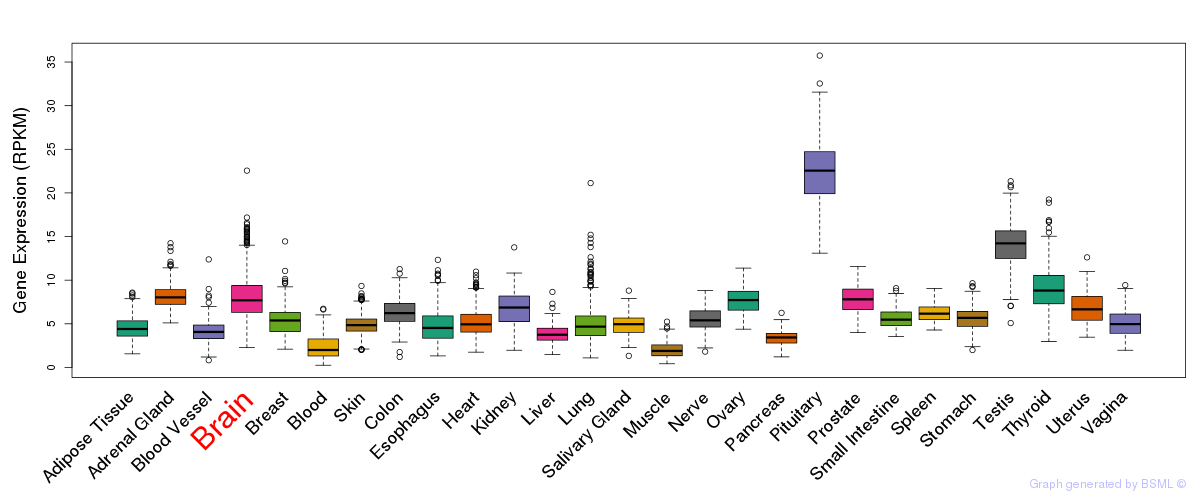
General gene expression (GTEx)
Gene expression during devlopment (BrainCloud)
Footnote:
A total of 269 time points ploted, with n=38 fetal samples (x=1:38). Each triangle represents one time point.
Gene expression of temporal and spatial changes (BrainSpan)
Footnote:
SC: sub-cortical regions; SM: sensory-motor regions; FC: frontal cortex; and TP: temporal-parietal cortex
ST1: fetal (13 - 26 postconception weeks), ST2: early infancy to late childhood (4 months to 11 years), and ST3: adolescence to adulthood (13 - 23 years)
The bar shown representes the lower 25% and upper 25% of the expression distribution.
Top co-expressed genes in brain regions
| Top 10 positively co-expressed genes | ||
| Gene | Pearson's Correlation | Spearman's Correlation |
| HDAC6 | 0.96 | 0.96 |
| RAF1 | 0.96 | 0.94 |
| DCAF15 | 0.95 | 0.95 |
| JUP | 0.95 | 0.94 |
| RBM15B | 0.95 | 0.95 |
| CSNK1E | 0.95 | 0.94 |
| IFT140 | 0.95 | 0.95 |
| AKT1 | 0.95 | 0.94 |
| EHMT2 | 0.94 | 0.95 |
| NUP62 | 0.94 | 0.93 |
| Top 10 negatively co-expressed genes | ||
| Gene | Pearson's Correlation | Spearman's Correlation |
| C5orf53 | -0.77 | -0.78 |
| AF347015.27 | -0.77 | -0.88 |
| AF347015.31 | -0.76 | -0.87 |
| MT-CO2 | -0.75 | -0.88 |
| AF347015.33 | -0.74 | -0.85 |
| S100B | -0.74 | -0.82 |
| HLA-F | -0.73 | -0.73 |
| MT-CYB | -0.72 | -0.84 |
| AIFM3 | -0.72 | -0.71 |
| AF347015.8 | -0.72 | -0.86 |
Section V. Pathway annotation
| Pathway name | Pathway size | # SZGR 2.0 genes in pathway | Info |
|---|---|---|---|
| GAZDA DIAMOND BLACKFAN ANEMIA ERYTHROID DN | 493 | 298 | All SZGR 2.0 genes in this pathway |
| GRAESSMANN APOPTOSIS BY DOXORUBICIN UP | 1142 | 669 | All SZGR 2.0 genes in this pathway |
| GRAESSMANN RESPONSE TO MC AND DOXORUBICIN UP | 612 | 367 | All SZGR 2.0 genes in this pathway |
| NUYTTEN EZH2 TARGETS DN | 1024 | 594 | All SZGR 2.0 genes in this pathway |
| BENPORATH NANOG TARGETS | 988 | 594 | All SZGR 2.0 genes in this pathway |
| BYSTRYKH HEMATOPOIESIS STEM CELL QTL TRANS | 882 | 572 | All SZGR 2.0 genes in this pathway |
| BYSTRYKH HEMATOPOIESIS STEM CELL FLI1 | 9 | 8 | All SZGR 2.0 genes in this pathway |
| DEBIASI APOPTOSIS BY REOVIRUS INFECTION DN | 287 | 208 | All SZGR 2.0 genes in this pathway |
| CREIGHTON ENDOCRINE THERAPY RESISTANCE 2 | 473 | 224 | All SZGR 2.0 genes in this pathway |
| MARSON BOUND BY E2F4 UNSTIMULATED | 728 | 415 | All SZGR 2.0 genes in this pathway |
| STEIN ESRRA TARGETS UP | 388 | 234 | All SZGR 2.0 genes in this pathway |
| STEIN ESRRA TARGETS | 535 | 325 | All SZGR 2.0 genes in this pathway |
| MARTENS TRETINOIN RESPONSE UP | 857 | 456 | All SZGR 2.0 genes in this pathway |
| PILON KLF1 TARGETS DN | 1972 | 1213 | All SZGR 2.0 genes in this pathway |
| BRUINS UVC RESPONSE EARLY LATE | 317 | 190 | All SZGR 2.0 genes in this pathway |
| KUMAR PATHOGEN LOAD BY MACROPHAGES | 275 | 155 | All SZGR 2.0 genes in this pathway |