Gene Page: CYB561D2
Summary ?
| GeneID | 11068 |
| Symbol | CYB561D2 |
| Synonyms | 101F6|TSP10|XXcos-LUCA11.4 |
| Description | cytochrome b561 family member D2 |
| Reference | MIM:607068|HGNC:HGNC:30253|Ensembl:ENSG00000114395|Ensembl:ENSG00000271858|HPRD:06143|Vega:OTTHUMG00000156813 |
| Gene type | protein-coding |
| Map location | 3p21.3 |
| Pascal p-value | 0.15 |
| Sherlock p-value | 0.449 |
| Fetal beta | -0.76 |
| DMG | 2 (# studies) |
Gene in Data Sources
| Gene set name | Method of gene set | Description | Info |
|---|---|---|---|
| DMG:Jaffe_2016 | Genome-wide DNA methylation analysis | This dataset includes 2,104 probes/CpGs associated with SZ patients (n=108) compared to 136 controls at Bonferroni-adjusted P < 0.05. | 2 |
| DMG:vanEijk_2014 | Genome-wide DNA methylation analysis | This dataset includes 432 differentially methylated CpG sites corresponding to 391 unique transcripts between schizophrenia patients (n=260) and unaffected controls (n=250). | 2 |
Section I. Genetics and epigenetics annotation
 Differentially methylated gene
| Probe | Chromosome | Position | Nearest gene | P (dis) | Beta (dis) | FDR (dis) | Study |
|---|---|---|---|---|---|---|---|
| cg16470957 | 3 | 50388565 | CYB561D2 | 6.56E-10 | -0.016 | 9.57E-7 | DMG:Jaffe_2016 |
| cg14358502 | 3 | 50337045 | CYB561D2 | 9.96E-5 | 2.62 | DMG:vanEijk_2014 |
Section II. Transcriptome annotation
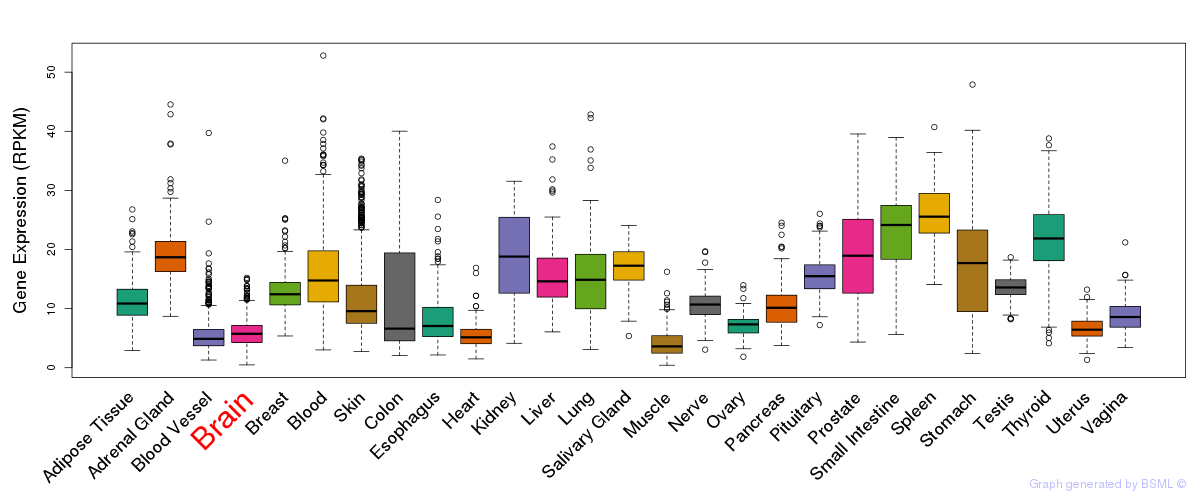
General gene expression (GTEx)
Gene expression during devlopment (BrainCloud)
Footnote:
A total of 269 time points ploted, with n=38 fetal samples (x=1:38). Each triangle represents one time point.
Gene expression of temporal and spatial changes (BrainSpan)
Footnote:
SC: sub-cortical regions; SM: sensory-motor regions; FC: frontal cortex; and TP: temporal-parietal cortex
ST1: fetal (13 - 26 postconception weeks), ST2: early infancy to late childhood (4 months to 11 years), and ST3: adolescence to adulthood (13 - 23 years)
The bar shown representes the lower 25% and upper 25% of the expression distribution.
Top co-expressed genes in brain regions
| Top 10 positively co-expressed genes | ||
| Gene | Pearson's Correlation | Spearman's Correlation |
| IL6ST | 0.84 | 0.86 |
| KIAA0494 | 0.83 | 0.85 |
| ADAM9 | 0.82 | 0.84 |
| MPP5 | 0.82 | 0.85 |
| UTRN | 0.81 | 0.85 |
| ITGAV | 0.81 | 0.82 |
| ACAP2 | 0.80 | 0.77 |
| ARHGAP5 | 0.80 | 0.79 |
| ERMP1 | 0.80 | 0.85 |
| RNF141 | 0.79 | 0.75 |
| Top 10 negatively co-expressed genes | ||
| Gene | Pearson's Correlation | Spearman's Correlation |
| RPL36 | -0.45 | -0.57 |
| RPL35 | -0.44 | -0.54 |
| RPL27 | -0.43 | -0.54 |
| RPS21 | -0.43 | -0.57 |
| SSR4 | -0.43 | -0.50 |
| RPLP1 | -0.43 | -0.53 |
| SNHG12 | -0.43 | -0.53 |
| NR2C2AP | -0.43 | -0.40 |
| RPS10 | -0.42 | -0.50 |
| RPLP2 | -0.42 | -0.53 |
Section V. Pathway annotation
| Pathway name | Pathway size | # SZGR 2.0 genes in pathway | Info |
|---|---|---|---|
| DODD NASOPHARYNGEAL CARCINOMA UP | 1821 | 933 | All SZGR 2.0 genes in this pathway |
| PEREZ TP53 TARGETS | 1174 | 695 | All SZGR 2.0 genes in this pathway |
| HESSON TUMOR SUPPRESSOR CLUSTER 3P21 3 | 7 | 5 | All SZGR 2.0 genes in this pathway |
| BENPORATH MYC MAX TARGETS | 775 | 494 | All SZGR 2.0 genes in this pathway |
| PENG LEUCINE DEPRIVATION UP | 142 | 93 | All SZGR 2.0 genes in this pathway |
| RADAEVA RESPONSE TO IFNA1 UP | 52 | 40 | All SZGR 2.0 genes in this pathway |
| MUNSHI MULTIPLE MYELOMA UP | 81 | 52 | All SZGR 2.0 genes in this pathway |
| KAAB HEART ATRIUM VS VENTRICLE UP | 249 | 170 | All SZGR 2.0 genes in this pathway |
| ACEVEDO LIVER CANCER UP | 973 | 570 | All SZGR 2.0 genes in this pathway |
| MILI PSEUDOPODIA HAPTOTAXIS DN | 668 | 419 | All SZGR 2.0 genes in this pathway |
| DANG BOUND BY MYC | 1103 | 714 | All SZGR 2.0 genes in this pathway |
| MARTENS TRETINOIN RESPONSE DN | 841 | 431 | All SZGR 2.0 genes in this pathway |
| LU EZH2 TARGETS UP | 295 | 155 | All SZGR 2.0 genes in this pathway |