Gene Page: WDR5
Summary ?
| GeneID | 11091 |
| Symbol | WDR5 |
| Synonyms | BIG-3|CFAP89|SWD3 |
| Description | WD repeat domain 5 |
| Reference | MIM:609012|HGNC:HGNC:12757|Ensembl:ENSG00000196363|HPRD:10614|Vega:OTTHUMG00000131707 |
| Gene type | protein-coding |
| Map location | 9q34 |
| Pascal p-value | 0.427 |
| Sherlock p-value | 0.925 |
| Fetal beta | -0.351 |
| DMG | 1 (# studies) |
| eGene | Cerebellar Hemisphere Cerebellum |
Gene in Data Sources
| Gene set name | Method of gene set | Description | Info |
|---|---|---|---|
| CV:PGCnp | Genome-wide Association Study | GWAS | |
| DMG:Jaffe_2016 | Genome-wide DNA methylation analysis | This dataset includes 2,104 probes/CpGs associated with SZ patients (n=108) compared to 136 controls at Bonferroni-adjusted P < 0.05. | 1 |
Section I. Genetics and epigenetics annotation
 Differentially methylated gene
| Probe | Chromosome | Position | Nearest gene | P (dis) | Beta (dis) | FDR (dis) | Study |
|---|---|---|---|---|---|---|---|
| cg06198335 | 9 | 137001969 | WDR5 | 3.92E-9 | -0.019 | 2.44E-6 | DMG:Jaffe_2016 |
Section II. Transcriptome annotation
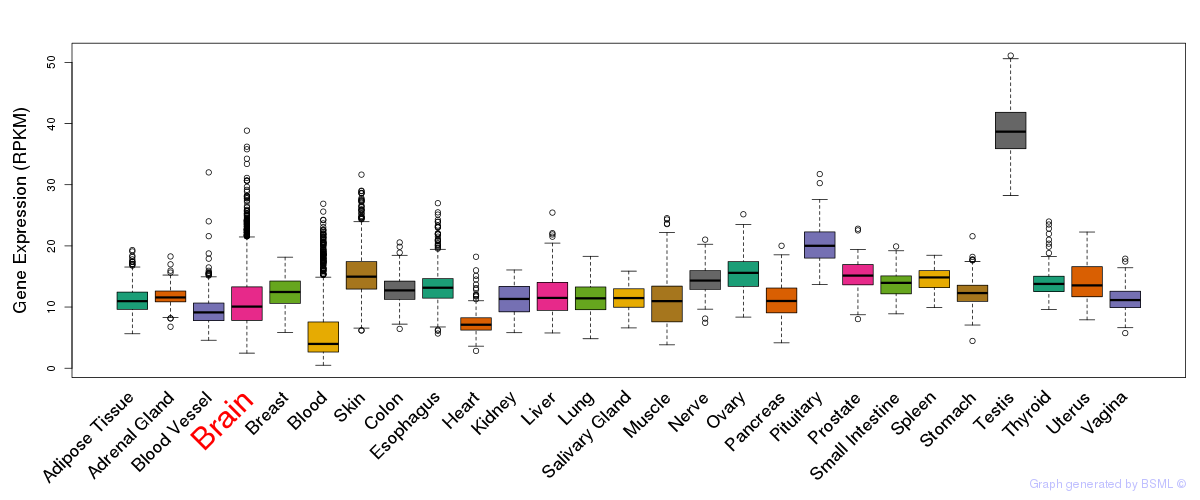
General gene expression (GTEx)
Gene expression during devlopment (BrainCloud)
Footnote:
A total of 269 time points ploted, with n=38 fetal samples (x=1:38). Each triangle represents one time point.
Gene expression of temporal and spatial changes (BrainSpan)
Footnote:
SC: sub-cortical regions; SM: sensory-motor regions; FC: frontal cortex; and TP: temporal-parietal cortex
ST1: fetal (13 - 26 postconception weeks), ST2: early infancy to late childhood (4 months to 11 years), and ST3: adolescence to adulthood (13 - 23 years)
The bar shown representes the lower 25% and upper 25% of the expression distribution.
Top co-expressed genes in brain regions
| Top 10 positively co-expressed genes | ||
| Gene | Pearson's Correlation | Spearman's Correlation |
| RNF216 | 0.88 | 0.88 |
| BTN2A1 | 0.87 | 0.86 |
| COPA | 0.87 | 0.87 |
| GTF3C1 | 0.87 | 0.87 |
| WWP2 | 0.86 | 0.88 |
| FTSJD2 | 0.86 | 0.85 |
| HDLBP | 0.86 | 0.83 |
| FBXO18 | 0.86 | 0.84 |
| SUPT6H | 0.86 | 0.86 |
| FAM120B | 0.86 | 0.86 |
| Top 10 negatively co-expressed genes | ||
| Gene | Pearson's Correlation | Spearman's Correlation |
| AF347015.21 | -0.76 | -0.75 |
| AF347015.31 | -0.73 | -0.73 |
| MT-CO2 | -0.72 | -0.72 |
| C1orf54 | -0.71 | -0.72 |
| HIGD1B | -0.70 | -0.69 |
| FXYD1 | -0.70 | -0.68 |
| IFI27 | -0.68 | -0.65 |
| AF347015.8 | -0.68 | -0.69 |
| AF347015.33 | -0.67 | -0.66 |
| AF347015.27 | -0.66 | -0.68 |
Section V. Pathway annotation
| Pathway name | Pathway size | # SZGR 2.0 genes in pathway | Info |
|---|---|---|---|
| PID CIRCADIAN PATHWAY | 16 | 15 | All SZGR 2.0 genes in this pathway |
| KINSEY TARGETS OF EWSR1 FLII FUSION UP | 1278 | 748 | All SZGR 2.0 genes in this pathway |
| FURUKAWA DUSP6 TARGETS PCI35 DN | 74 | 40 | All SZGR 2.0 genes in this pathway |
| NUYTTEN EZH2 TARGETS DN | 1024 | 594 | All SZGR 2.0 genes in this pathway |
| LIAO METASTASIS | 539 | 324 | All SZGR 2.0 genes in this pathway |
| TONG INTERACT WITH PTTG1 | 57 | 32 | All SZGR 2.0 genes in this pathway |
| GARCIA TARGETS OF FLI1 AND DAX1 DN | 176 | 104 | All SZGR 2.0 genes in this pathway |
| KONDO PROSTATE CANCER HCP WITH H3K27ME3 | 97 | 72 | All SZGR 2.0 genes in this pathway |
| DANG BOUND BY MYC | 1103 | 714 | All SZGR 2.0 genes in this pathway |
| PILON KLF1 TARGETS DN | 1972 | 1213 | All SZGR 2.0 genes in this pathway |
| BRUINS UVC RESPONSE LATE | 1137 | 655 | All SZGR 2.0 genes in this pathway |
| LEE BMP2 TARGETS DN | 882 | 538 | All SZGR 2.0 genes in this pathway |
| BOUDOUKHA BOUND BY IGF2BP2 | 111 | 59 | All SZGR 2.0 genes in this pathway |