Gene Page: KRR1
Summary ?
| GeneID | 11103 |
| Symbol | KRR1 |
| Synonyms | HRB2|RIP-1 |
| Description | KRR1, small subunit (SSU) processome component, homolog (yeast) |
| Reference | MIM:612817|HGNC:HGNC:5176|HPRD:11027| |
| Gene type | protein-coding |
| Map location | 12q21.2 |
| Pascal p-value | 0.992 |
| Fetal beta | 0.378 |
| eGene | Myers' cis & trans |
Gene in Data Sources
| Gene set name | Method of gene set | Description | Info |
|---|---|---|---|
| CV:GWASdb | Genome-wide Association Studies | GWASdb records for schizophrenia | |
| CV:PGCnp | Genome-wide Association Study | GWAS |
Section I. Genetics and epigenetics annotation
 eQTL annotation
| SNP ID | Chromosome | Position | eGene | Gene Entrez ID | pvalue | qvalue | TSS distance | eQTL type |
|---|---|---|---|---|---|---|---|---|
| rs10062990 | chr5 | 33685862 | KRR1 | 11103 | 0.12 | trans |
Section II. Transcriptome annotation
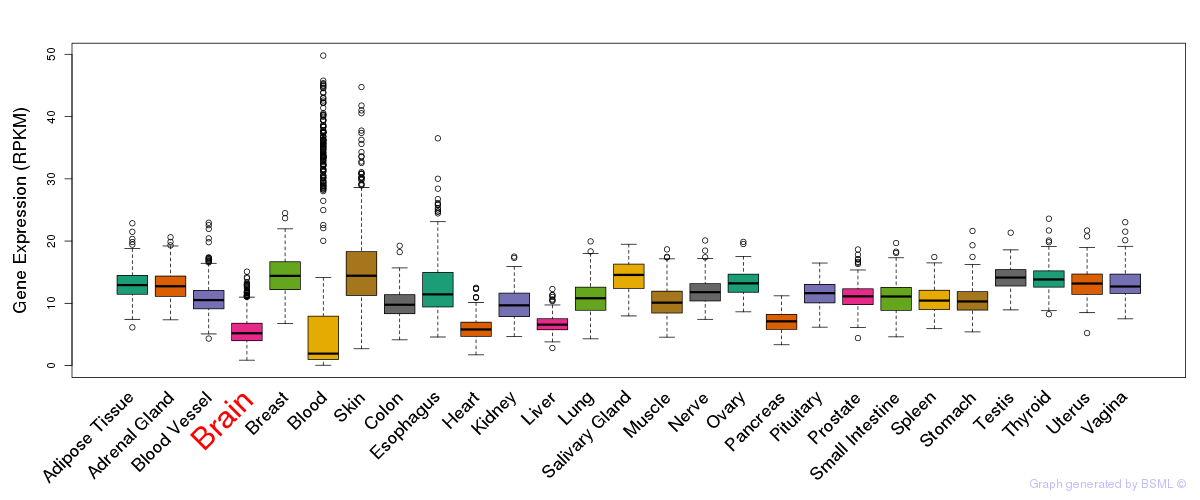
General gene expression (GTEx)

Gene expression during devlopment (BrainCloud)
Footnote:
A total of 269 time points ploted, with n=38 fetal samples (x=1:38). Each triangle represents one time point.
Gene expression of temporal and spatial changes (BrainSpan)
Footnote:
SC: sub-cortical regions; SM: sensory-motor regions; FC: frontal cortex; and TP: temporal-parietal cortex
ST1: fetal (13 - 26 postconception weeks), ST2: early infancy to late childhood (4 months to 11 years), and ST3: adolescence to adulthood (13 - 23 years)
The bar shown representes the lower 25% and upper 25% of the expression distribution.
Top co-expressed genes in brain regions
| Top 10 positively co-expressed genes | ||
| Gene | Pearson's Correlation | Spearman's Correlation |
| MBD1 | 0.85 | 0.86 |
| GATS | 0.85 | 0.84 |
| RPAP1 | 0.83 | 0.83 |
| ATP13A1 | 0.83 | 0.82 |
| ZDHHC18 | 0.83 | 0.83 |
| BAHD1 | 0.83 | 0.83 |
| USP21 | 0.83 | 0.81 |
| TNPO2 | 0.83 | 0.85 |
| ZNF142 | 0.83 | 0.83 |
| FOXK2 | 0.83 | 0.83 |
| Top 10 negatively co-expressed genes | ||
| Gene | Pearson's Correlation | Spearman's Correlation |
| AF347015.31 | -0.64 | -0.67 |
| AF347015.21 | -0.63 | -0.73 |
| MT-CO2 | -0.63 | -0.66 |
| AF347015.27 | -0.63 | -0.67 |
| AF347015.8 | -0.62 | -0.66 |
| AL139819.3 | -0.62 | -0.69 |
| MT-CYB | -0.61 | -0.64 |
| AF347015.33 | -0.59 | -0.61 |
| AF347015.15 | -0.58 | -0.62 |
| AF347015.2 | -0.57 | -0.59 |
Section V. Pathway annotation
| Pathway name | Pathway size | # SZGR 2.0 genes in pathway | Info |
|---|---|---|---|
| WANG LMO4 TARGETS UP | 372 | 227 | All SZGR 2.0 genes in this pathway |
| KINSEY TARGETS OF EWSR1 FLII FUSION UP | 1278 | 748 | All SZGR 2.0 genes in this pathway |
| HAMAI APOPTOSIS VIA TRAIL UP | 584 | 356 | All SZGR 2.0 genes in this pathway |
| LINDGREN BLADDER CANCER CLUSTER 2B | 392 | 251 | All SZGR 2.0 genes in this pathway |
| NUYTTEN NIPP1 TARGETS UP | 769 | 437 | All SZGR 2.0 genes in this pathway |
| NUYTTEN NIPP1 TARGETS DN | 848 | 527 | All SZGR 2.0 genes in this pathway |
| NUYTTEN EZH2 TARGETS UP | 1037 | 673 | All SZGR 2.0 genes in this pathway |
| BENPORATH NANOG TARGETS | 988 | 594 | All SZGR 2.0 genes in this pathway |
| NOUZOVA TRETINOIN AND H4 ACETYLATION | 143 | 85 | All SZGR 2.0 genes in this pathway |
| DEBIASI APOPTOSIS BY REOVIRUS INFECTION UP | 314 | 201 | All SZGR 2.0 genes in this pathway |
| IVANOVA HEMATOPOIESIS STEM CELL LONG TERM | 302 | 191 | All SZGR 2.0 genes in this pathway |
| DAZARD RESPONSE TO UV SCC UP | 123 | 75 | All SZGR 2.0 genes in this pathway |
| MARSON BOUND BY FOXP3 UNSTIMULATED | 1229 | 713 | All SZGR 2.0 genes in this pathway |
| CHANG CORE SERUM RESPONSE UP | 212 | 128 | All SZGR 2.0 genes in this pathway |
| SHEDDEN LUNG CANCER POOR SURVIVAL A6 | 456 | 285 | All SZGR 2.0 genes in this pathway |
| MILI PSEUDOPODIA HAPTOTAXIS UP | 518 | 299 | All SZGR 2.0 genes in this pathway |
| YAGI AML WITH INV 16 TRANSLOCATION | 422 | 277 | All SZGR 2.0 genes in this pathway |
| BROWNE HCMV INFECTION 1HR DN | 222 | 147 | All SZGR 2.0 genes in this pathway |
| BROWNE HCMV INFECTION 4HR DN | 254 | 158 | All SZGR 2.0 genes in this pathway |
| PILON KLF1 TARGETS DN | 1972 | 1213 | All SZGR 2.0 genes in this pathway |
| LEE BMP2 TARGETS DN | 882 | 538 | All SZGR 2.0 genes in this pathway |