Gene Page: FAF1
Summary ?
| GeneID | 11124 |
| Symbol | FAF1 |
| Synonyms | CGI-03|HFAF1s|UBXD12|UBXN3A|hFAF1 |
| Description | Fas associated factor 1 |
| Reference | MIM:604460|HGNC:HGNC:3578|HPRD:05124| |
| Gene type | protein-coding |
| Map location | 1p33 |
| Pascal p-value | 0.323 |
| Sherlock p-value | 0.773 |
| Fetal beta | 0.773 |
| DMG | 1 (# studies) |
| eGene | Myers' cis & trans |
| Support | Ascano FMRP targets |
Gene in Data Sources
| Gene set name | Method of gene set | Description | Info |
|---|---|---|---|
| CV:GWASdb | Genome-wide Association Studies | GWASdb records for schizophrenia | |
| CV:PGCnp | Genome-wide Association Study | GWAS | |
| DMG:Wockner_2014 | Genome-wide DNA methylation analysis | This dataset includes 4641 differentially methylated probes corresponding to 2929 unique genes between schizophrenia patients (n=24) and controls (n=24). | 1 |
Section I. Genetics and epigenetics annotation
 Differentially methylated gene
| Probe | Chromosome | Position | Nearest gene | P (dis) | Beta (dis) | FDR (dis) | Study |
|---|---|---|---|---|---|---|---|
| cg15574895 | 1 | 51133602 | FAF1 | 2.974E-4 | -0.492 | 0.039 | DMG:Wockner_2014 |
eQTL annotation
| SNP ID | Chromosome | Position | eGene | Gene Entrez ID | pvalue | qvalue | TSS distance | eQTL type |
|---|---|---|---|---|---|---|---|---|
| rs1578978 | chr8 | 118196802 | FAF1 | 11124 | 0.06 | trans |
Section II. Transcriptome annotation
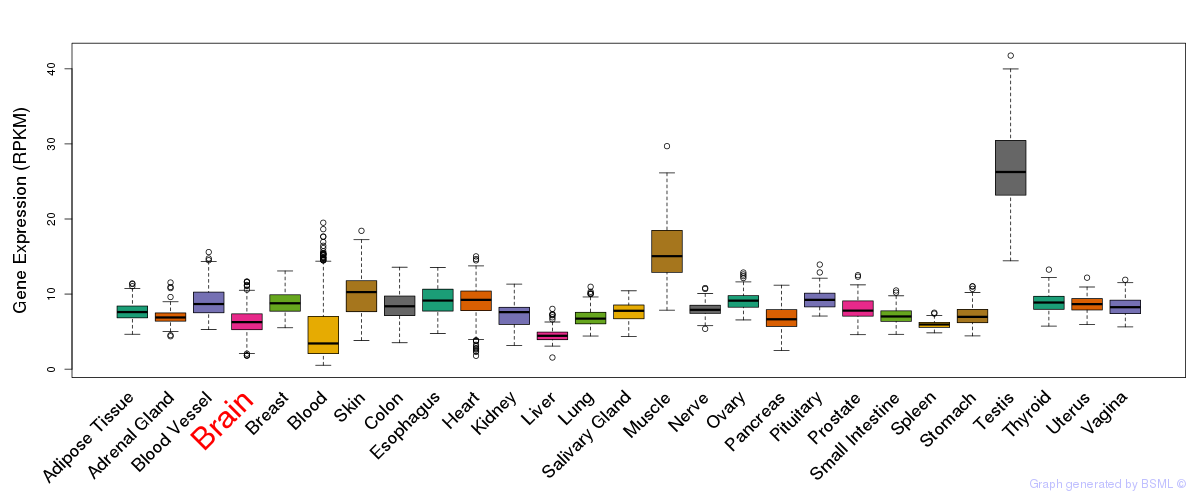
General gene expression (GTEx)
Gene expression during devlopment (BrainCloud)
Footnote:
A total of 269 time points ploted, with n=38 fetal samples (x=1:38). Each triangle represents one time point.
Gene expression of temporal and spatial changes (BrainSpan)
Footnote:
SC: sub-cortical regions; SM: sensory-motor regions; FC: frontal cortex; and TP: temporal-parietal cortex
ST1: fetal (13 - 26 postconception weeks), ST2: early infancy to late childhood (4 months to 11 years), and ST3: adolescence to adulthood (13 - 23 years)
The bar shown representes the lower 25% and upper 25% of the expression distribution.
Top co-expressed genes in brain regions
| Top 10 positively co-expressed genes | ||
| Gene | Pearson's Correlation | Spearman's Correlation |
| ERCC2 | 0.88 | 0.87 |
| GPS1 | 0.88 | 0.88 |
| ERAL1 | 0.88 | 0.85 |
| TMEM115 | 0.88 | 0.86 |
| MCRS1 | 0.87 | 0.85 |
| TMEM180 | 0.87 | 0.87 |
| DMAP1 | 0.87 | 0.86 |
| MRPS2 | 0.87 | 0.87 |
| THAP4 | 0.87 | 0.84 |
| TBRG4 | 0.86 | 0.84 |
| Top 10 negatively co-expressed genes | ||
| Gene | Pearson's Correlation | Spearman's Correlation |
| AF347015.21 | -0.70 | -0.71 |
| AF347015.8 | -0.69 | -0.66 |
| MT-CO2 | -0.69 | -0.65 |
| AF347015.31 | -0.68 | -0.64 |
| AF347015.27 | -0.67 | -0.66 |
| MT-CYB | -0.67 | -0.65 |
| MT-ATP8 | -0.66 | -0.71 |
| AF347015.2 | -0.65 | -0.61 |
| AF347015.33 | -0.64 | -0.62 |
| AL139819.3 | -0.64 | -0.63 |
Section V. Pathway annotation
| Pathway name | Pathway size | # SZGR 2.0 genes in pathway | Info |
|---|---|---|---|
| BIOCARTA FAS PATHWAY | 30 | 22 | All SZGR 2.0 genes in this pathway |
| ST FAS SIGNALING PATHWAY | 65 | 54 | All SZGR 2.0 genes in this pathway |
| PARENT MTOR SIGNALING UP | 567 | 375 | All SZGR 2.0 genes in this pathway |
| LIU SOX4 TARGETS DN | 309 | 191 | All SZGR 2.0 genes in this pathway |
| RODRIGUES THYROID CARCINOMA POORLY DIFFERENTIATED UP | 633 | 376 | All SZGR 2.0 genes in this pathway |
| RODRIGUES THYROID CARCINOMA ANAPLASTIC UP | 722 | 443 | All SZGR 2.0 genes in this pathway |
| LINDGREN BLADDER CANCER CLUSTER 3 UP | 329 | 196 | All SZGR 2.0 genes in this pathway |
| LASTOWSKA NEUROBLASTOMA COPY NUMBER DN | 800 | 473 | All SZGR 2.0 genes in this pathway |
| HATADA METHYLATED IN LUNG CANCER UP | 390 | 236 | All SZGR 2.0 genes in this pathway |
| TOMLINS METASTASIS UP | 14 | 9 | All SZGR 2.0 genes in this pathway |
| TCGA GLIOBLASTOMA COPY NUMBER DN | 31 | 21 | All SZGR 2.0 genes in this pathway |
| MARTINEZ RESPONSE TO TRABECTEDIN DN | 271 | 175 | All SZGR 2.0 genes in this pathway |
| MARSON BOUND BY FOXP3 STIMULATED | 1022 | 619 | All SZGR 2.0 genes in this pathway |
| WANG TUMOR INVASIVENESS UP | 374 | 247 | All SZGR 2.0 genes in this pathway |
| YAO TEMPORAL RESPONSE TO PROGESTERONE CLUSTER 17 | 181 | 101 | All SZGR 2.0 genes in this pathway |
| JOHNSTONE PARVB TARGETS 2 DN | 336 | 211 | All SZGR 2.0 genes in this pathway |
| WAKABAYASHI ADIPOGENESIS PPARG BOUND 8D | 658 | 397 | All SZGR 2.0 genes in this pathway |