Gene Page: BVES
Summary ?
| GeneID | 11149 |
| Symbol | BVES |
| Synonyms | HBVES|LGMD2X|POP1|POPDC1 |
| Description | blood vessel epicardial substance |
| Reference | MIM:604577|HGNC:HGNC:1152|Ensembl:ENSG00000112276|HPRD:06842|Vega:OTTHUMG00000015291 |
| Gene type | protein-coding |
| Map location | 6q21 |
| Pascal p-value | 0.105 |
| Fetal beta | -0.752 |
| DMG | 1 (# studies) |
| eGene | Meta |
Gene in Data Sources
| Gene set name | Method of gene set | Description | Info |
|---|---|---|---|
| CV:PGCnp | Genome-wide Association Study | GWAS | |
| DMG:Wockner_2014 | Genome-wide DNA methylation analysis | This dataset includes 4641 differentially methylated probes corresponding to 2929 unique genes between schizophrenia patients (n=24) and controls (n=24). | 1 |
Section I. Genetics and epigenetics annotation
 Differentially methylated gene
| Probe | Chromosome | Position | Nearest gene | P (dis) | Beta (dis) | FDR (dis) | Study |
|---|---|---|---|---|---|---|---|
| cg13725782 | 6 | 105584718 | BVES | 1.612E-4 | -0.215 | 0.032 | DMG:Wockner_2014 |
Section II. Transcriptome annotation
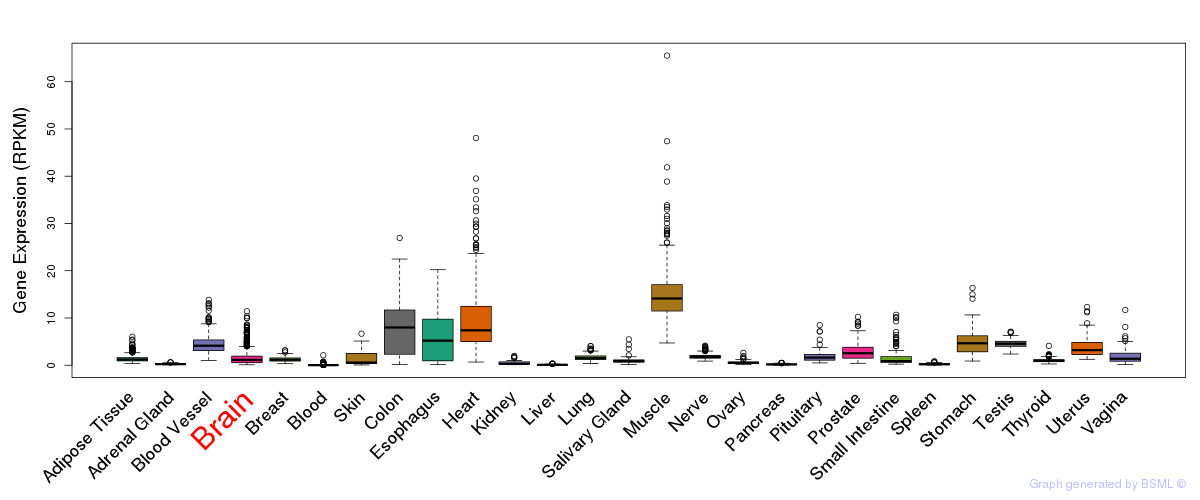
General gene expression (GTEx)
Gene expression during devlopment (BrainCloud)
Footnote:
A total of 269 time points ploted, with n=38 fetal samples (x=1:38). Each triangle represents one time point.
Gene expression of temporal and spatial changes (BrainSpan)
Footnote:
SC: sub-cortical regions; SM: sensory-motor regions; FC: frontal cortex; and TP: temporal-parietal cortex
ST1: fetal (13 - 26 postconception weeks), ST2: early infancy to late childhood (4 months to 11 years), and ST3: adolescence to adulthood (13 - 23 years)
The bar shown representes the lower 25% and upper 25% of the expression distribution.
Top co-expressed genes in brain regions
| Top 10 positively co-expressed genes | ||
| Gene | Pearson's Correlation | Spearman's Correlation |
| GPR172A | 0.92 | 0.93 |
| SGTA | 0.91 | 0.90 |
| MRPS2 | 0.91 | 0.92 |
| LRWD1 | 0.91 | 0.93 |
| KLHL22 | 0.91 | 0.92 |
| CCDC115 | 0.91 | 0.91 |
| PPP2R1A | 0.91 | 0.90 |
| MANEAL | 0.91 | 0.92 |
| MED24 | 0.91 | 0.91 |
| UBA1 | 0.91 | 0.90 |
| Top 10 negatively co-expressed genes | ||
| Gene | Pearson's Correlation | Spearman's Correlation |
| AF347015.33 | -0.76 | -0.84 |
| MT-CO2 | -0.76 | -0.83 |
| AF347015.27 | -0.76 | -0.83 |
| AF347015.8 | -0.76 | -0.84 |
| AF347015.31 | -0.75 | -0.81 |
| MT-CYB | -0.74 | -0.82 |
| AF347015.15 | -0.71 | -0.81 |
| AF347015.2 | -0.71 | -0.82 |
| AF347015.21 | -0.71 | -0.84 |
| AF347015.26 | -0.70 | -0.81 |
Section V. Pathway annotation
| Pathway name | Pathway size | # SZGR 2.0 genes in pathway | Info |
|---|---|---|---|
| WANG CLIM2 TARGETS UP | 269 | 146 | All SZGR 2.0 genes in this pathway |
| GAUSSMANN MLL AF4 FUSION TARGETS E UP | 97 | 60 | All SZGR 2.0 genes in this pathway |
| PEREZ TP53 TARGETS | 1174 | 695 | All SZGR 2.0 genes in this pathway |
| BENPORATH EED TARGETS | 1062 | 725 | All SZGR 2.0 genes in this pathway |
| DOUGLAS BMI1 TARGETS DN | 314 | 188 | All SZGR 2.0 genes in this pathway |
| MEISSNER BRAIN HCP WITH H3K4ME3 AND H3K27ME3 | 1069 | 729 | All SZGR 2.0 genes in this pathway |
| ROME INSULIN TARGETS IN MUSCLE UP | 442 | 263 | All SZGR 2.0 genes in this pathway |
| BRUINS UVC RESPONSE VIA TP53 GROUP C | 92 | 60 | All SZGR 2.0 genes in this pathway |
| KASLER HDAC7 TARGETS 1 UP | 194 | 133 | All SZGR 2.0 genes in this pathway |
| PEDRIOLI MIR31 TARGETS DN | 418 | 245 | All SZGR 2.0 genes in this pathway |
| LIM MAMMARY STEM CELL UP | 489 | 314 | All SZGR 2.0 genes in this pathway |
| ZWANG TRANSIENTLY UP BY 1ST EGF PULSE ONLY | 1839 | 928 | All SZGR 2.0 genes in this pathway |