Gene Page: CHM
Summary ?
| GeneID | 1121 |
| Symbol | CHM |
| Synonyms | DXS540|GGTA|HSD-32|REP-1|TCD |
| Description | CHM, Rab escort protein 1 |
| Reference | MIM:300390|HGNC:HGNC:1940|Ensembl:ENSG00000188419|HPRD:02312|HPRD:06563|Vega:OTTHUMG00000021937 |
| Gene type | protein-coding |
| Map location | Xq21.2 |
| Fetal beta | -0.99 |
| eGene | Myers' cis & trans |
Gene in Data Sources
| Gene set name | Method of gene set | Description | Info |
|---|---|---|---|
| CV:PGCnp | Genome-wide Association Study | GWAS | |
| PMID:cooccur | High-throughput literature-search | Systematic search in PubMed for genes co-occurring with SCZ keywords. A total of 3027 genes were included. | |
| Literature | High-throughput literature-search | Co-occurance with Schizophrenia keywords: schizophrenia,schizophrenic,schizophrenias | Click to show details |
Section I. Genetics and epigenetics annotation
 eQTL annotation
| SNP ID | Chromosome | Position | eGene | Gene Entrez ID | pvalue | qvalue | TSS distance | eQTL type |
|---|---|---|---|---|---|---|---|---|
| rs16836102 | chr4 | 4716366 | CHM | 1121 | 0.17 | trans |
Section II. Transcriptome annotation
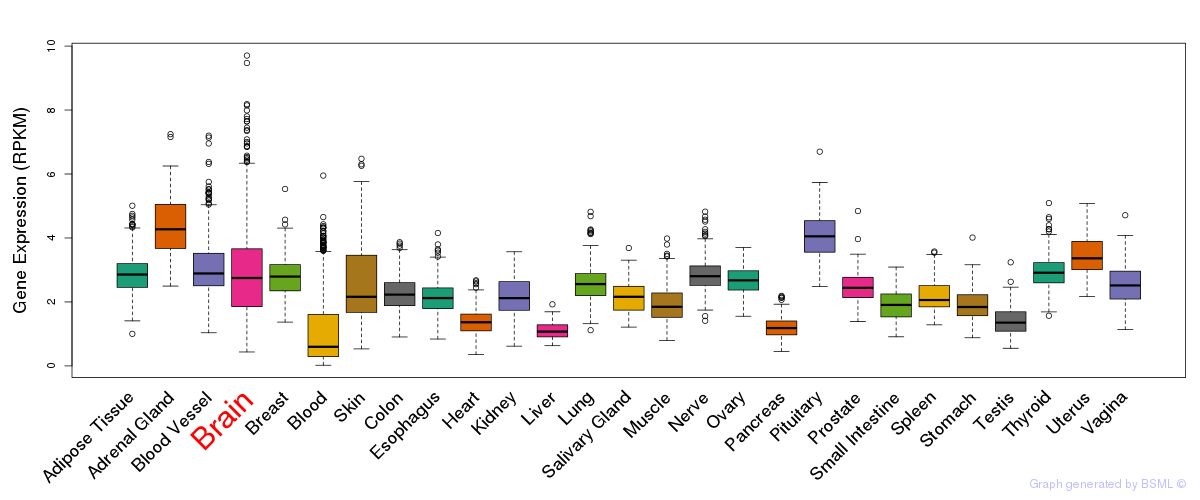
General gene expression (GTEx)
Gene expression during devlopment (BrainCloud)
Footnote:
A total of 269 time points ploted, with n=38 fetal samples (x=1:38). Each triangle represents one time point.
Gene expression of temporal and spatial changes (BrainSpan)
Footnote:
SC: sub-cortical regions; SM: sensory-motor regions; FC: frontal cortex; and TP: temporal-parietal cortex
ST1: fetal (13 - 26 postconception weeks), ST2: early infancy to late childhood (4 months to 11 years), and ST3: adolescence to adulthood (13 - 23 years)
The bar shown representes the lower 25% and upper 25% of the expression distribution.
Top co-expressed genes in brain regions
| Top 10 positively co-expressed genes | ||
| Gene | Pearson's Correlation | Spearman's Correlation |
| ACSL3 | 0.76 | 0.80 |
| PCDHAC2 | 0.75 | 0.86 |
| PGM2L1 | 0.75 | 0.83 |
| TBC1D9 | 0.74 | 0.85 |
| MEF2A | 0.74 | 0.84 |
| GRIN3A | 0.74 | 0.79 |
| SLC9A6 | 0.73 | 0.83 |
| ACSL4 | 0.72 | 0.83 |
| UBE3C | 0.72 | 0.82 |
| LRFN5 | 0.72 | 0.77 |
| Top 10 negatively co-expressed genes | ||
| Gene | Pearson's Correlation | Spearman's Correlation |
| ACSF2 | -0.45 | -0.61 |
| EIF4EBP3 | -0.44 | -0.58 |
| FXYD1 | -0.43 | -0.52 |
| CLDN10 | -0.41 | -0.48 |
| SLC25A18 | -0.41 | -0.50 |
| SELENBP1 | -0.41 | -0.52 |
| IMPA2 | -0.41 | -0.57 |
| ROM1 | -0.41 | -0.52 |
| AC021016.1 | -0.40 | -0.54 |
| ACADS | -0.40 | -0.53 |
Section V. Pathway annotation
| Pathway name | Pathway size | # SZGR 2.0 genes in pathway | Info |
|---|---|---|---|
| CONCANNON APOPTOSIS BY EPOXOMICIN UP | 239 | 157 | All SZGR 2.0 genes in this pathway |
| GRAESSMANN APOPTOSIS BY DOXORUBICIN DN | 1781 | 1082 | All SZGR 2.0 genes in this pathway |
| GEORGES TARGETS OF MIR192 AND MIR215 | 893 | 528 | All SZGR 2.0 genes in this pathway |
| MIKKELSEN ES ICP WITH H3K4ME3 | 718 | 401 | All SZGR 2.0 genes in this pathway |
| MIKKELSEN NPC ICP WITH H3K4ME3 | 445 | 257 | All SZGR 2.0 genes in this pathway |
| BRUINS UVC RESPONSE VIA TP53 GROUP A | 898 | 516 | All SZGR 2.0 genes in this pathway |
| TORCHIA TARGETS OF EWSR1 FLI1 FUSION DN | 321 | 200 | All SZGR 2.0 genes in this pathway |