Gene Page: CIDEA
Summary ?
| GeneID | 1149 |
| Symbol | CIDEA |
| Synonyms | CIDE-A |
| Description | cell death-inducing DFFA-like effector a |
| Reference | MIM:604440|HGNC:HGNC:1976|Ensembl:ENSG00000176194|HPRD:08380|Vega:OTTHUMG00000131691 |
| Gene type | protein-coding |
| Map location | 18p11.21|18 |
| Pascal p-value | 0.348 |
| Sherlock p-value | 0.828 |
| Fetal beta | -0.697 |
| DMG | 1 (# studies) |
| eGene | Meta |
Gene in Data Sources
| Gene set name | Method of gene set | Description | Info |
|---|---|---|---|
| CV:PGCnp | Genome-wide Association Study | GWAS | |
| DMG:Wockner_2014 | Genome-wide DNA methylation analysis | This dataset includes 4641 differentially methylated probes corresponding to 2929 unique genes between schizophrenia patients (n=24) and controls (n=24). | 1 |
| PMID:cooccur | High-throughput literature-search | Systematic search in PubMed for genes co-occurring with SCZ keywords. A total of 3027 genes were included. | |
| Literature | High-throughput literature-search | Co-occurance with Schizophrenia keywords: schizophrenia,schizophrenias | Click to show details |
Section I. Genetics and epigenetics annotation
 Differentially methylated gene
| Probe | Chromosome | Position | Nearest gene | P (dis) | Beta (dis) | FDR (dis) | Study |
|---|---|---|---|---|---|---|---|
| cg17991823 | 18 | 12254473 | CIDEA | 2.813E-4 | -0.506 | 0.039 | DMG:Wockner_2014 |
Section II. Transcriptome annotation
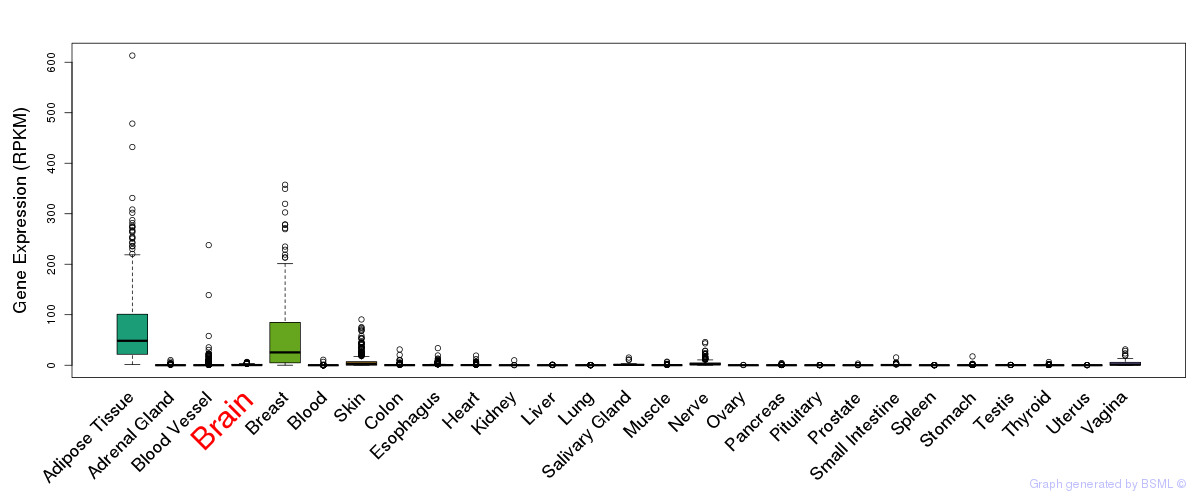
General gene expression (GTEx)
Gene expression during devlopment (BrainCloud)
Footnote:
A total of 269 time points ploted, with n=38 fetal samples (x=1:38). Each triangle represents one time point.
Gene expression of temporal and spatial changes (BrainSpan)
Footnote:
SC: sub-cortical regions; SM: sensory-motor regions; FC: frontal cortex; and TP: temporal-parietal cortex
ST1: fetal (13 - 26 postconception weeks), ST2: early infancy to late childhood (4 months to 11 years), and ST3: adolescence to adulthood (13 - 23 years)
The bar shown representes the lower 25% and upper 25% of the expression distribution.
Top co-expressed genes in brain regions
| Top 10 positively co-expressed genes | ||
| Gene | Pearson's Correlation | Spearman's Correlation |
| TOP1MT | 0.60 | 0.59 |
| B4GALNT4 | 0.60 | 0.60 |
| C18orf22 | 0.60 | 0.56 |
| ZNF205 | 0.58 | 0.60 |
| TAS1R3 | 0.58 | 0.58 |
| OBSCN | 0.58 | 0.63 |
| ZNF428 | 0.58 | 0.55 |
| SPSB3 | 0.58 | 0.56 |
| GPSM1 | 0.57 | 0.59 |
| TEKT2 | 0.57 | 0.57 |
| Top 10 negatively co-expressed genes | ||
| Gene | Pearson's Correlation | Spearman's Correlation |
| C5orf53 | -0.45 | -0.55 |
| COPZ2 | -0.44 | -0.54 |
| ALDOC | -0.43 | -0.48 |
| S100B | -0.43 | -0.53 |
| ABCG2 | -0.43 | -0.49 |
| AF347015.31 | -0.43 | -0.55 |
| AF347015.27 | -0.42 | -0.54 |
| CA4 | -0.42 | -0.49 |
| B2M | -0.41 | -0.51 |
| ITM2B | -0.41 | -0.46 |
Section V. Pathway annotation
| Pathway name | Pathway size | # SZGR 2.0 genes in pathway | Info |
|---|---|---|---|
| MCBRYAN PUBERTAL BREAST 4 5WK DN | 196 | 131 | All SZGR 2.0 genes in this pathway |
| BORLAK LIVER CANCER EGF UP | 57 | 41 | All SZGR 2.0 genes in this pathway |
| HATADA METHYLATED IN LUNG CANCER UP | 390 | 236 | All SZGR 2.0 genes in this pathway |
| SCHAEFFER PROSTATE DEVELOPMENT 12HR UP | 116 | 79 | All SZGR 2.0 genes in this pathway |
| BENPORATH SUZ12 TARGETS | 1038 | 678 | All SZGR 2.0 genes in this pathway |
| BENPORATH EED TARGETS | 1062 | 725 | All SZGR 2.0 genes in this pathway |
| BENPORATH ES WITH H3K27ME3 | 1118 | 744 | All SZGR 2.0 genes in this pathway |
| BENPORATH PRC2 TARGETS | 652 | 441 | All SZGR 2.0 genes in this pathway |
| LEE LIVER CANCER CIPROFIBRATE UP | 60 | 42 | All SZGR 2.0 genes in this pathway |
| CHEN METABOLIC SYNDROM NETWORK | 1210 | 725 | All SZGR 2.0 genes in this pathway |
| WONG ADULT TISSUE STEM MODULE | 721 | 492 | All SZGR 2.0 genes in this pathway |
| STEGER ADIPOGENESIS UP | 21 | 16 | All SZGR 2.0 genes in this pathway |
| SERVITJA ISLET HNF1A TARGETS UP | 163 | 111 | All SZGR 2.0 genes in this pathway |
| DELACROIX RAR BOUND ES | 462 | 273 | All SZGR 2.0 genes in this pathway |
| RAO BOUND BY SALL4 | 227 | 149 | All SZGR 2.0 genes in this pathway |