Gene Page: TSGA13
Summary ?
| GeneID | 114960 |
| Symbol | TSGA13 |
| Synonyms | - |
| Description | testis specific 13 |
| Reference | HGNC:HGNC:12369|Ensembl:ENSG00000213265|HPRD:11650|Vega:OTTHUMG00000154999 |
| Gene type | protein-coding |
| Map location | 7q32 |
| Pascal p-value | 0.984 |
| Fetal beta | -0.453 |
| DMG | 1 (# studies) |
Gene in Data Sources
| Gene set name | Method of gene set | Description | Info |
|---|---|---|---|
| DMG:Jaffe_2016 | Genome-wide DNA methylation analysis | This dataset includes 2,104 probes/CpGs associated with SZ patients (n=108) compared to 136 controls at Bonferroni-adjusted P < 0.05. | 2 |
| DNM:Gulsuner_2013 | Whole Exome Sequencing analysis | 155 DNMs identified by exome sequencing of quads or trios of schizophrenia individuals and their parents. |
Section I. Genetics and epigenetics annotation
 DNM table
| Gene | Chromosome | Position | Ref | Alt | Transcript | AA change | Mutation type | Sift | CG46 | Trait | Study |
|---|---|---|---|---|---|---|---|---|---|---|---|
| TSGA13 | chr7 | 130368463 | C | T | NM_052933 | p.24R>H | missense | Schizophrenia | DNM:Gulsuner_2013 |
Differentially methylated gene
| Probe | Chromosome | Position | Nearest gene | P (dis) | Beta (dis) | FDR (dis) | Study |
|---|---|---|---|---|---|---|---|
| cg23822045 | 7 | 130353761 | TSGA13 | 6.76E-10 | -0.014 | 9.69E-7 | DMG:Jaffe_2016 |
| cg27195917 | 7 | 130353961 | TSGA13 | 9.1E-9 | -0.01 | 4.12E-6 | DMG:Jaffe_2016 |
Section II. Transcriptome annotation
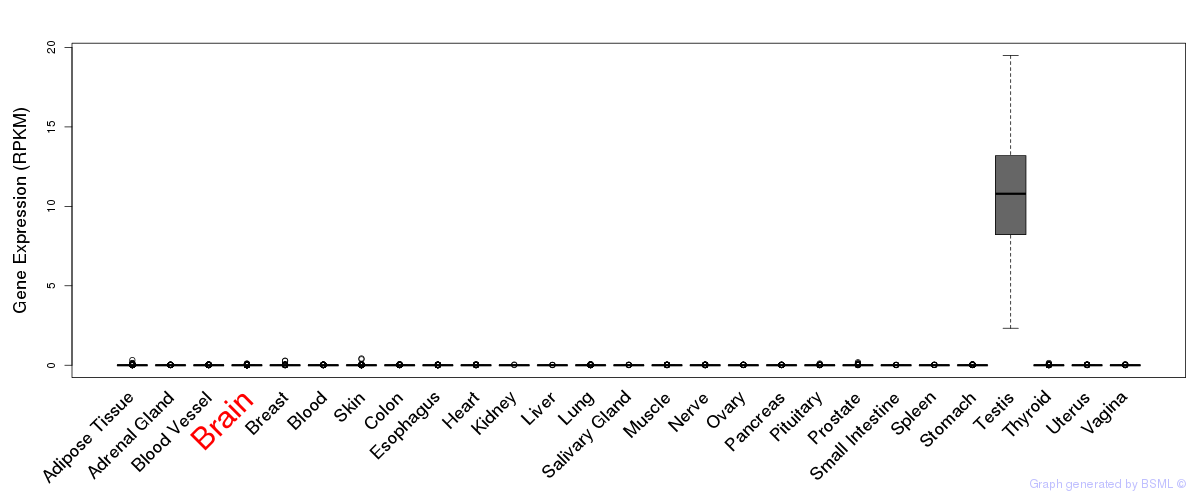
General gene expression (GTEx)
Gene expression during devlopment (BrainCloud)
Footnote:
A total of 269 time points ploted, with n=38 fetal samples (x=1:38). Each triangle represents one time point.
Gene expression of temporal and spatial changes (BrainSpan)
Footnote:
SC: sub-cortical regions; SM: sensory-motor regions; FC: frontal cortex; and TP: temporal-parietal cortex
ST1: fetal (13 - 26 postconception weeks), ST2: early infancy to late childhood (4 months to 11 years), and ST3: adolescence to adulthood (13 - 23 years)
The bar shown representes the lower 25% and upper 25% of the expression distribution.
No co-expressed genes in brain regions
Section V. Pathway annotation
| Pathway name | Pathway size | # SZGR 2.0 genes in pathway | Info |
|---|---|---|---|
| ZHOU INFLAMMATORY RESPONSE FIMA UP | 544 | 308 | All SZGR 2.0 genes in this pathway |
| KOYAMA SEMA3B TARGETS DN | 411 | 249 | All SZGR 2.0 genes in this pathway |
| ACEVEDO LIVER CANCER WITH H3K27ME3 UP | 295 | 149 | All SZGR 2.0 genes in this pathway |
| CONRAD GERMLINE STEM CELL | 13 | 8 | All SZGR 2.0 genes in this pathway |