Gene Page: NIPA1
Summary ?
| GeneID | 123606 |
| Symbol | NIPA1 |
| Synonyms | FSP3|SPG6 |
| Description | non imprinted in Prader-Willi/Angelman syndrome 1 |
| Reference | MIM:608145|HGNC:HGNC:17043|Ensembl:ENSG00000170113|HPRD:10487|Vega:OTTHUMG00000129099 |
| Gene type | protein-coding |
| Map location | 15q11.2 |
| Pascal p-value | 0.025 |
| Fetal beta | -1.072 |
Gene in Data Sources
| Gene set name | Method of gene set | Description | Info |
|---|---|---|---|
| CV:PGCnp | Genome-wide Association Study | GWAS | |
| PMID:cooccur | High-throughput literature-search | Systematic search in PubMed for genes co-occurring with SCZ keywords. A total of 3027 genes were included. | |
| Literature | High-throughput literature-search | Co-occurance with Schizophrenia keywords: schizophrenia,schizophrenias | Click to show details |
Section I. Genetics and epigenetics annotation
Section II. Transcriptome annotation
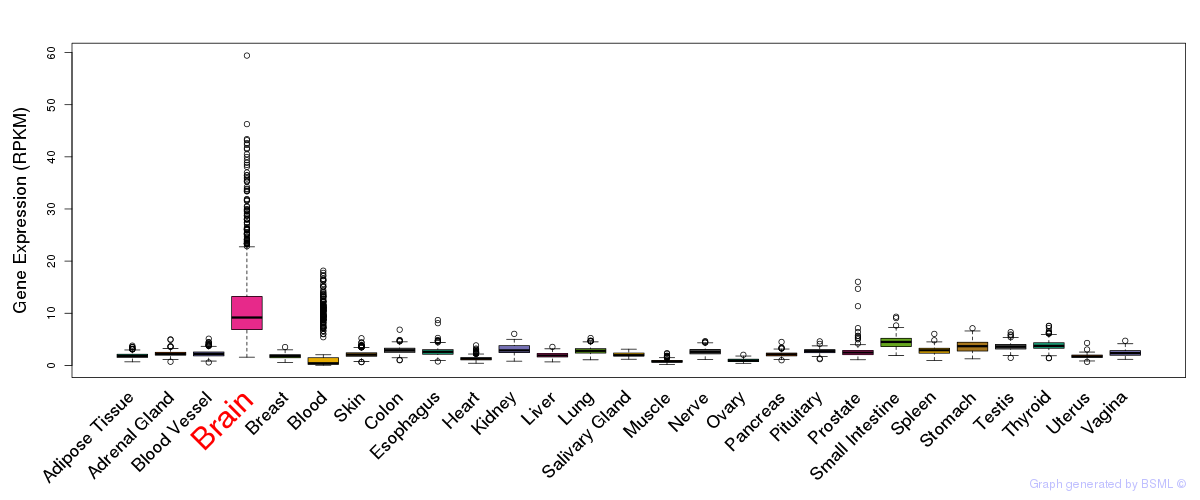
General gene expression (GTEx)
Gene expression during devlopment (BrainCloud)
Footnote:
A total of 269 time points ploted, with n=38 fetal samples (x=1:38). Each triangle represents one time point.
Gene expression of temporal and spatial changes (BrainSpan)
Footnote:
SC: sub-cortical regions; SM: sensory-motor regions; FC: frontal cortex; and TP: temporal-parietal cortex
ST1: fetal (13 - 26 postconception weeks), ST2: early infancy to late childhood (4 months to 11 years), and ST3: adolescence to adulthood (13 - 23 years)
The bar shown representes the lower 25% and upper 25% of the expression distribution.
Top co-expressed genes in brain regions
| Top 10 positively co-expressed genes | ||
| Gene | Pearson's Correlation | Spearman's Correlation |
| TMEM70 | 0.71 | 0.65 |
| AC023598.3 | 0.68 | 0.67 |
| NDUFAF1 | 0.66 | 0.64 |
| UROS | 0.66 | 0.66 |
| NDUFV2 | 0.65 | 0.69 |
| SERGEF | 0.65 | 0.62 |
| UQCRFSL1 | 0.65 | 0.59 |
| MDH1 | 0.64 | 0.67 |
| C8orf38 | 0.63 | 0.60 |
| DNAJC19 | 0.63 | 0.64 |
| Top 10 negatively co-expressed genes | ||
| Gene | Pearson's Correlation | Spearman's Correlation |
| AF347015.18 | -0.41 | -0.12 |
| AC010300.1 | -0.41 | -0.27 |
| AC100783.1 | -0.39 | -0.26 |
| IL4R | -0.39 | -0.28 |
| CASKIN2 | -0.39 | -0.36 |
| MTSS1L | -0.38 | -0.36 |
| PXN | -0.38 | -0.39 |
| SMTN | -0.38 | -0.39 |
| EDN1 | -0.37 | -0.21 |
| NFKBIA | -0.37 | -0.31 |
Section V. Pathway annotation
| Pathway name | Pathway size | # SZGR 2.0 genes in pathway | Info |
|---|---|---|---|
| GARGALOVIC RESPONSE TO OXIDIZED PHOSPHOLIPIDS TURQUOISE UP | 79 | 50 | All SZGR 2.0 genes in this pathway |
| KINSEY TARGETS OF EWSR1 FLII FUSION UP | 1278 | 748 | All SZGR 2.0 genes in this pathway |
| GAUSSMANN MLL AF4 FUSION TARGETS G UP | 238 | 135 | All SZGR 2.0 genes in this pathway |
| STARK PREFRONTAL CORTEX 22Q11 DELETION DN | 517 | 309 | All SZGR 2.0 genes in this pathway |
| GEORGES TARGETS OF MIR192 AND MIR215 | 893 | 528 | All SZGR 2.0 genes in this pathway |
| VANTVEER BREAST CANCER METASTASIS DN | 121 | 65 | All SZGR 2.0 genes in this pathway |
| BILD E2F3 ONCOGENIC SIGNATURE | 246 | 153 | All SZGR 2.0 genes in this pathway |
| CREIGHTON ENDOCRINE THERAPY RESISTANCE 3 | 720 | 440 | All SZGR 2.0 genes in this pathway |
| MARSON BOUND BY FOXP3 UNSTIMULATED | 1229 | 713 | All SZGR 2.0 genes in this pathway |
| IWANAGA CARCINOGENESIS BY KRAS UP | 170 | 107 | All SZGR 2.0 genes in this pathway |
| MATZUK SPERMATOZOA | 114 | 77 | All SZGR 2.0 genes in this pathway |
| BOYLAN MULTIPLE MYELOMA D UP | 89 | 62 | All SZGR 2.0 genes in this pathway |
| CHYLA CBFA2T3 TARGETS DN | 242 | 146 | All SZGR 2.0 genes in this pathway |
| KRIEG HYPOXIA NOT VIA KDM3A | 770 | 480 | All SZGR 2.0 genes in this pathway |