Gene Page: SLC43A2
Summary ?
| GeneID | 124935 |
| Symbol | SLC43A2 |
| Synonyms | LAT4 |
| Description | solute carrier family 43 member 2 |
| Reference | MIM:610791|HGNC:HGNC:23087|Ensembl:ENSG00000167703|HPRD:15390|Vega:OTTHUMG00000090345 |
| Gene type | protein-coding |
| Map location | 17p13.3 |
| Pascal p-value | 0.273 |
| Sherlock p-value | 0.369 |
| Fetal beta | -0.842 |
| DMG | 1 (# studies) |
Gene in Data Sources
| Gene set name | Method of gene set | Description | Info |
|---|---|---|---|
| CV:PGCnp | Genome-wide Association Study | GWAS | |
| DMG:Wockner_2014 | Genome-wide DNA methylation analysis | This dataset includes 4641 differentially methylated probes corresponding to 2929 unique genes between schizophrenia patients (n=24) and controls (n=24). | 3 |
Section I. Genetics and epigenetics annotation
 Differentially methylated gene
| Probe | Chromosome | Position | Nearest gene | P (dis) | Beta (dis) | FDR (dis) | Study |
|---|---|---|---|---|---|---|---|
| cg19880947 | 17 | 1510000 | SLC43A2 | 2.58E-5 | 0.382 | 0.017 | DMG:Wockner_2014 |
| cg10025200 | 17 | 1477843 | SLC43A2 | 3.82E-5 | -0.441 | 0.02 | DMG:Wockner_2014 |
| cg02238950 | 17 | 1505303 | SLC43A2 | 5.163E-4 | 0.153 | 0.047 | DMG:Wockner_2014 |
Section II. Transcriptome annotation
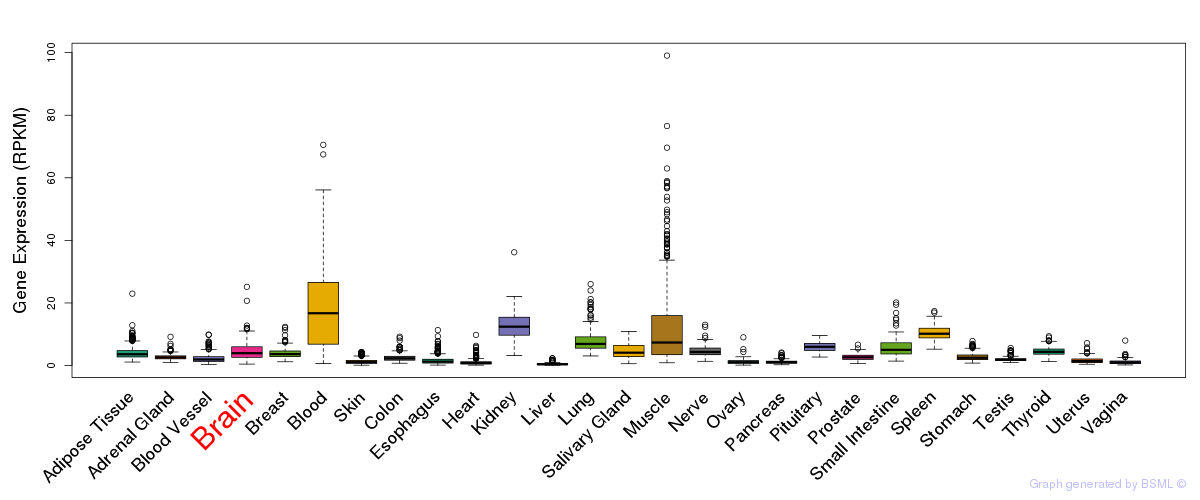
General gene expression (GTEx)
Gene expression during devlopment (BrainCloud)
Footnote:
A total of 269 time points ploted, with n=38 fetal samples (x=1:38). Each triangle represents one time point.
Gene expression of temporal and spatial changes (BrainSpan)
Footnote:
SC: sub-cortical regions; SM: sensory-motor regions; FC: frontal cortex; and TP: temporal-parietal cortex
ST1: fetal (13 - 26 postconception weeks), ST2: early infancy to late childhood (4 months to 11 years), and ST3: adolescence to adulthood (13 - 23 years)
The bar shown representes the lower 25% and upper 25% of the expression distribution.
Top co-expressed genes in brain regions
| Top 10 positively co-expressed genes | ||
| Gene | Pearson's Correlation | Spearman's Correlation |
| SNW1 | 0.88 | 0.88 |
| GPBP1 | 0.87 | 0.87 |
| PSPC1 | 0.87 | 0.88 |
| NCBP2 | 0.87 | 0.88 |
| PSIP1 | 0.87 | 0.87 |
| TSR1 | 0.87 | 0.86 |
| VPS45 | 0.87 | 0.86 |
| PLRG1 | 0.87 | 0.89 |
| TIAL1 | 0.86 | 0.86 |
| TRA2B | 0.86 | 0.87 |
| Top 10 negatively co-expressed genes | ||
| Gene | Pearson's Correlation | Spearman's Correlation |
| MT-CO2 | -0.79 | -0.83 |
| MT-CYB | -0.76 | -0.82 |
| AF347015.27 | -0.76 | -0.82 |
| AF347015.8 | -0.76 | -0.82 |
| AF347015.31 | -0.75 | -0.81 |
| AF347015.33 | -0.75 | -0.80 |
| AF347015.15 | -0.73 | -0.82 |
| AF347015.2 | -0.72 | -0.80 |
| AF347015.26 | -0.71 | -0.80 |
| AF347015.21 | -0.71 | -0.79 |
Section V. Pathway annotation
| Pathway name | Pathway size | # SZGR 2.0 genes in pathway | Info |
|---|---|---|---|
| REACTOME AMINO ACID TRANSPORT ACROSS THE PLASMA MEMBRANE | 31 | 21 | All SZGR 2.0 genes in this pathway |
| REACTOME TRANSMEMBRANE TRANSPORT OF SMALL MOLECULES | 413 | 270 | All SZGR 2.0 genes in this pathway |
| REACTOME SLC MEDIATED TRANSMEMBRANE TRANSPORT | 241 | 157 | All SZGR 2.0 genes in this pathway |
| REACTOME TRANSPORT OF INORGANIC CATIONS ANIONS AND AMINO ACIDS OLIGOPEPTIDES | 94 | 65 | All SZGR 2.0 genes in this pathway |
| REACTOME AMINO ACID AND OLIGOPEPTIDE SLC TRANSPORTERS | 49 | 36 | All SZGR 2.0 genes in this pathway |
| CHEBOTAEV GR TARGETS UP | 77 | 62 | All SZGR 2.0 genes in this pathway |
| IVANOVA HEMATOPOIESIS STEM CELL LONG TERM | 302 | 191 | All SZGR 2.0 genes in this pathway |
| IVANOVA HEMATOPOIESIS STEM CELL AND PROGENITOR | 681 | 420 | All SZGR 2.0 genes in this pathway |
| IWANAGA CARCINOGENESIS BY KRAS UP | 170 | 107 | All SZGR 2.0 genes in this pathway |
| IWANAGA CARCINOGENESIS BY KRAS DN | 120 | 81 | All SZGR 2.0 genes in this pathway |
| ZWANG TRANSIENTLY UP BY 1ST EGF PULSE ONLY | 1839 | 928 | All SZGR 2.0 genes in this pathway |