Gene Page: MRPL55
Summary ?
| GeneID | 128308 |
| Symbol | MRPL55 |
| Synonyms | AAVG5835|L55nt|MRP-L55|PRO19675 |
| Description | mitochondrial ribosomal protein L55 |
| Reference | MIM:611859|HGNC:HGNC:16686|Ensembl:ENSG00000162910|HPRD:14773|Vega:OTTHUMG00000037965 |
| Gene type | protein-coding |
| Map location | 1q42.13 |
| Sherlock p-value | 0.002 |
| Fetal beta | -0.906 |
| DMG | 1 (# studies) |
| eGene | Caudate basal ganglia Cerebellum Frontal Cortex BA9 Myers' cis & trans Meta |
Gene in Data Sources
| Gene set name | Method of gene set | Description | Info |
|---|---|---|---|
| CV:PGCnp | Genome-wide Association Study | GWAS | |
| DMG:Wockner_2014 | Genome-wide DNA methylation analysis | This dataset includes 4641 differentially methylated probes corresponding to 2929 unique genes between schizophrenia patients (n=24) and controls (n=24). | 2 |
Section I. Genetics and epigenetics annotation
 Differentially methylated gene
| Probe | Chromosome | Position | Nearest gene | P (dis) | Beta (dis) | FDR (dis) | Study |
|---|---|---|---|---|---|---|---|
| cg22163199 | 1 | 228297864 | MRPL55 | 3.186E-4 | 0.392 | 0.04 | DMG:Wockner_2014 |
| cg09462576 | 1 | 228297873 | MRPL55 | 4.519E-4 | 0.404 | 0.045 | DMG:Wockner_2014 |
eQTL annotation
| SNP ID | Chromosome | Position | eGene | Gene Entrez ID | pvalue | qvalue | TSS distance | eQTL type |
|---|---|---|---|---|---|---|---|---|
| rs2878 | chr7 | 102953620 | MRPL55 | 128308 | 0.06 | trans | ||
| rs1362732 | chr18 | 25212017 | MRPL55 | 128308 | 0.09 | trans |
Section II. Transcriptome annotation
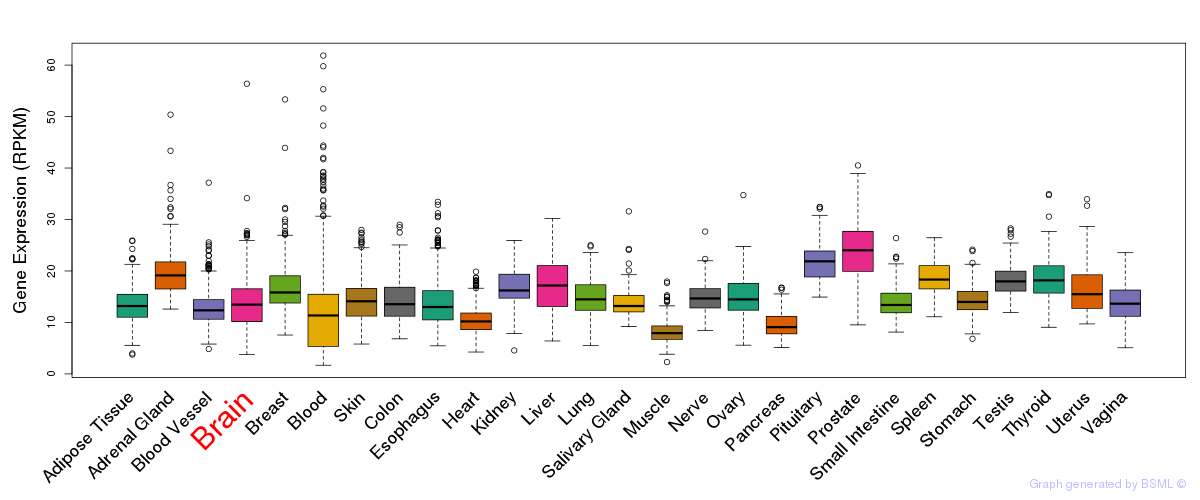
General gene expression (GTEx)
Gene expression during devlopment (BrainCloud)
Footnote:
A total of 269 time points ploted, with n=38 fetal samples (x=1:38). Each triangle represents one time point.
Gene expression of temporal and spatial changes (BrainSpan)
Footnote:
SC: sub-cortical regions; SM: sensory-motor regions; FC: frontal cortex; and TP: temporal-parietal cortex
ST1: fetal (13 - 26 postconception weeks), ST2: early infancy to late childhood (4 months to 11 years), and ST3: adolescence to adulthood (13 - 23 years)
The bar shown representes the lower 25% and upper 25% of the expression distribution.
No co-expressed genes in brain regions
Section V. Pathway annotation
| Pathway name | Pathway size | # SZGR 2.0 genes in pathway | Info |
|---|---|---|---|
| STARK PREFRONTAL CORTEX 22Q11 DELETION DN | 517 | 309 | All SZGR 2.0 genes in this pathway |
| FIGUEROA AML METHYLATION CLUSTER 1 UP | 125 | 61 | All SZGR 2.0 genes in this pathway |