Gene Page: DIS3L2
Summary ?
| GeneID | 129563 |
| Symbol | DIS3L2 |
| Synonyms | FAM6A|PRLMNS|hDIS3L2 |
| Description | DIS3 like 3'-5' exoribonuclease 2 |
| Reference | MIM:614184|HGNC:HGNC:28648|Ensembl:ENSG00000144535|HPRD:14619|Vega:OTTHUMG00000153385 |
| Gene type | protein-coding |
| Map location | 2q37.1 |
| Pascal p-value | 0.017 |
| Fetal beta | -0.556 |
| DMG | 3 (# studies) |
Gene in Data Sources
| Gene set name | Method of gene set | Description | Info |
|---|---|---|---|
| CV:GWASdb | Genome-wide Association Studies | GWASdb records for schizophrenia | |
| CV:PGCnp | Genome-wide Association Study | GWAS | |
| DMG:Jaffe_2016 | Genome-wide DNA methylation analysis | This dataset includes 2,104 probes/CpGs associated with SZ patients (n=108) compared to 136 controls at Bonferroni-adjusted P < 0.05. | 3 |
| DMG:Montano_2016 | Genome-wide DNA methylation analysis | This dataset includes 172 replicated associations between CpGs with schizophrenia. | 3 |
| DMG:Wockner_2014 | Genome-wide DNA methylation analysis | This dataset includes 4641 differentially methylated probes corresponding to 2929 unique genes between schizophrenia patients (n=24) and controls (n=24). | 3 |
Section I. Genetics and epigenetics annotation
 Differentially methylated gene
| Probe | Chromosome | Position | Nearest gene | P (dis) | Beta (dis) | FDR (dis) | Study |
|---|---|---|---|---|---|---|---|
| cg07328664 | 2 | 233125062 | DIS3L2 | 1.62E-4 | 0.005 | 0.143 | DMG:Montano_2016 |
| cg26133217 | 2 | 233157602 | DIS3L2 | 5.859E-4 | -0.29 | 0.05 | DMG:Wockner_2014 |
| cg15868237 | 2 | 232826200 | DIS3L2 | 1.07E-8 | -0.006 | 4.57E-6 | DMG:Jaffe_2016 |
Section II. Transcriptome annotation
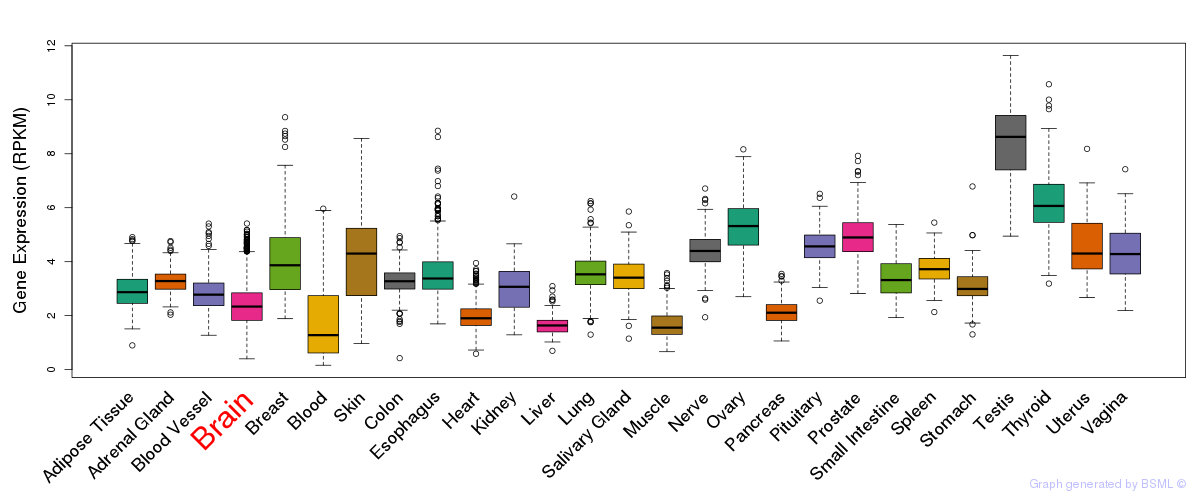
General gene expression (GTEx)
Gene expression during devlopment (BrainCloud)
Footnote:
A total of 269 time points ploted, with n=38 fetal samples (x=1:38). Each triangle represents one time point.
Gene expression of temporal and spatial changes (BrainSpan)
Footnote:
SC: sub-cortical regions; SM: sensory-motor regions; FC: frontal cortex; and TP: temporal-parietal cortex
ST1: fetal (13 - 26 postconception weeks), ST2: early infancy to late childhood (4 months to 11 years), and ST3: adolescence to adulthood (13 - 23 years)
The bar shown representes the lower 25% and upper 25% of the expression distribution.
No co-expressed genes in brain regions
Section V. Pathway annotation
| Pathway name | Pathway size | # SZGR 2.0 genes in pathway | Info |
|---|---|---|---|
| OSMAN BLADDER CANCER DN | 406 | 230 | All SZGR 2.0 genes in this pathway |
| PEREZ TP53 TARGETS | 1174 | 695 | All SZGR 2.0 genes in this pathway |
| RICKMAN METASTASIS UP | 344 | 180 | All SZGR 2.0 genes in this pathway |