Gene Page: SGCZ
Summary ?
| GeneID | 137868 |
| Symbol | SGCZ |
| Synonyms | ZSG1 |
| Description | sarcoglycan zeta |
| Reference | MIM:608113|HGNC:HGNC:14075|Ensembl:ENSG00000185053|HPRD:12165|Vega:OTTHUMG00000090827 |
| Gene type | protein-coding |
| Map location | 8p22 |
| Fetal beta | -0.229 |
Gene in Data Sources
| Gene set name | Method of gene set | Description | Info |
|---|---|---|---|
| CV:GWAScat | Genome-wide Association Studies | This data set includes 560 SNPs associated with schizophrenia. A total of 486 genes were mapped to these SNPs within 50kb. | |
| CV:GWASdb | Genome-wide Association Studies | GWASdb records for schizophrenia | |
| CV:PGCnp | Genome-wide Association Study | GWAS | |
| GSMA_I | Genome scan meta-analysis | Psr: 0.031 |
Section I. Genetics and epigenetics annotation
Section II. Transcriptome annotation
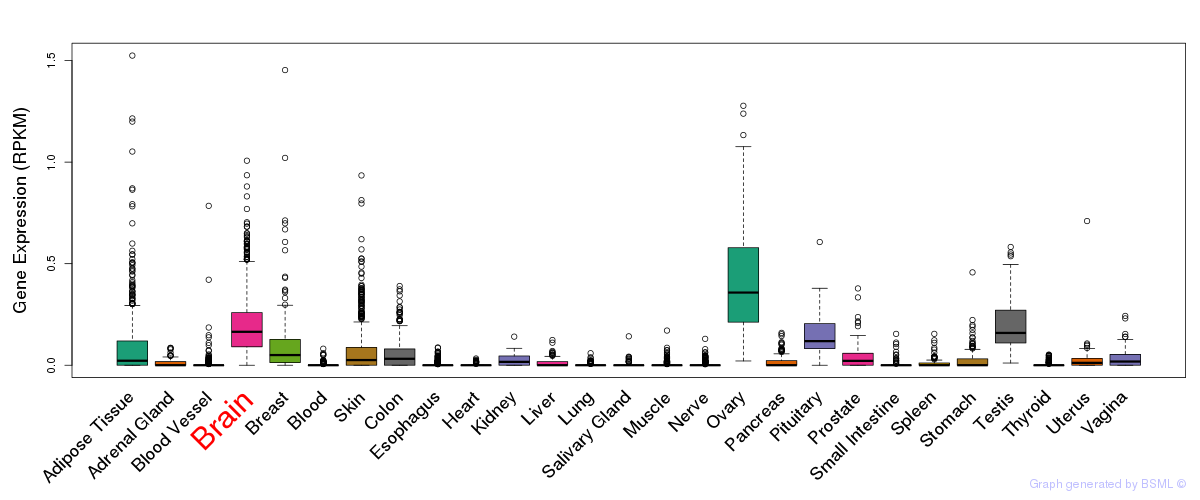
General gene expression (GTEx)
Gene expression during devlopment (BrainCloud)
Footnote:
A total of 269 time points ploted, with n=38 fetal samples (x=1:38). Each triangle represents one time point.
Gene expression of temporal and spatial changes (BrainSpan)
Footnote:
SC: sub-cortical regions; SM: sensory-motor regions; FC: frontal cortex; and TP: temporal-parietal cortex
ST1: fetal (13 - 26 postconception weeks), ST2: early infancy to late childhood (4 months to 11 years), and ST3: adolescence to adulthood (13 - 23 years)
The bar shown representes the lower 25% and upper 25% of the expression distribution.
No co-expressed genes in brain regions
Section III. Gene Ontology annotation
| Molecular function | GO term | Evidence | Neuro keywords | PubMed ID |
|---|---|---|---|---|
| GO:0005515 | protein binding | IEA | - | |
| Biological process | GO term | Evidence | Neuro keywords | PubMed ID |
| GO:0007010 | cytoskeleton organization | IEA | - | |
| Cellular component | GO term | Evidence | Neuro keywords | PubMed ID |
| GO:0005856 | cytoskeleton | IEA | - | |
| GO:0005737 | cytoplasm | IEA | - | |
| GO:0016021 | integral to membrane | IEA | - | |
| GO:0005886 | plasma membrane | IEA | - | |
| GO:0016012 | sarcoglycan complex | IEA | - |
Section V. Pathway annotation
| Pathway name | Pathway size | # SZGR 2.0 genes in pathway | Info |
|---|---|---|---|
| MAYBURD RESPONSE TO L663536 UP | 29 | 18 | All SZGR 2.0 genes in this pathway |
| DOUGLAS BMI1 TARGETS DN | 314 | 188 | All SZGR 2.0 genes in this pathway |
Section VI. microRNA annotation
| miRNA family | Target position | miRNA ID | miRNA seq | ||
|---|---|---|---|---|---|
| UTR start | UTR end | Match method | |||
| miR-124/506 | 268 | 274 | m8 | hsa-miR-506 | UAAGGCACCCUUCUGAGUAGA |
| hsa-miR-124brain | UAAGGCACGCGGUGAAUGCC | ||||
| miR-155 | 485 | 491 | m8 | hsa-miR-155 | UUAAUGCUAAUCGUGAUAGGGG |
| miR-204/211 | 250 | 256 | m8 | hsa-miR-204brain | UUCCCUUUGUCAUCCUAUGCCU |
| hsa-miR-211 | UUCCCUUUGUCAUCCUUCGCCU | ||||
| miR-218 | 289 | 295 | m8 | hsa-miR-218brain | UUGUGCUUGAUCUAACCAUGU |
| hsa-miR-218brain | UUGUGCUUGAUCUAACCAUGU | ||||
| miR-539 | 9 | 15 | m8 | hsa-miR-539 | GGAGAAAUUAUCCUUGGUGUGU |
- SZ: miRNAs which differentially expressed in brain cortex of schizophrenia patients comparing with control samples using microarray. Click here to see the list of SZ related miRNAs.
- Brain: miRNAs which are expressed in brain based on miRNA microarray expression studies. Click here to see the list of brain related miRNAs.