Gene Page: MIB2
Summary ?
| GeneID | 142678 |
| Symbol | MIB2 |
| Synonyms | ZZANK1|ZZZ5 |
| Description | mindbomb E3 ubiquitin protein ligase 2 |
| Reference | MIM:611141|HGNC:HGNC:30577|Ensembl:ENSG00000197530|HPRD:15905|Vega:OTTHUMG00000074647 |
| Gene type | protein-coding |
| Map location | 1p36.33 |
| Pascal p-value | 0.054 |
| Fetal beta | 0.49 |
| DMG | 1 (# studies) |
| eGene | Myers' cis & trans |
Gene in Data Sources
| Gene set name | Method of gene set | Description | Info |
|---|---|---|---|
| DMG:Wockner_2014 | Genome-wide DNA methylation analysis | This dataset includes 4641 differentially methylated probes corresponding to 2929 unique genes between schizophrenia patients (n=24) and controls (n=24). | 1 |
Section I. Genetics and epigenetics annotation
 Differentially methylated gene
| Probe | Chromosome | Position | Nearest gene | P (dis) | Beta (dis) | FDR (dis) | Study |
|---|---|---|---|---|---|---|---|
| cg09061216 | 1 | 1558936 | MIB2 | 1.312E-4 | 0.282 | 0.03 | DMG:Wockner_2014 |
eQTL annotation
| SNP ID | Chromosome | Position | eGene | Gene Entrez ID | pvalue | qvalue | TSS distance | eQTL type |
|---|---|---|---|---|---|---|---|---|
| rs10014766 | chr4 | 113376845 | MIB2 | 142678 | 0.16 | trans | ||
| rs10077678 | chr5 | 34708890 | MIB2 | 142678 | 0.16 | trans | ||
| rs10893579 | chr11 | 126688631 | MIB2 | 142678 | 0.15 | trans | ||
| rs10750347 | chr11 | 126695832 | MIB2 | 142678 | 0.12 | trans | ||
| rs1946064 | chr11 | 126727946 | MIB2 | 142678 | 0.06 | trans | ||
| rs7947480 | chr11 | 126735192 | MIB2 | 142678 | 0.07 | trans |
Section II. Transcriptome annotation
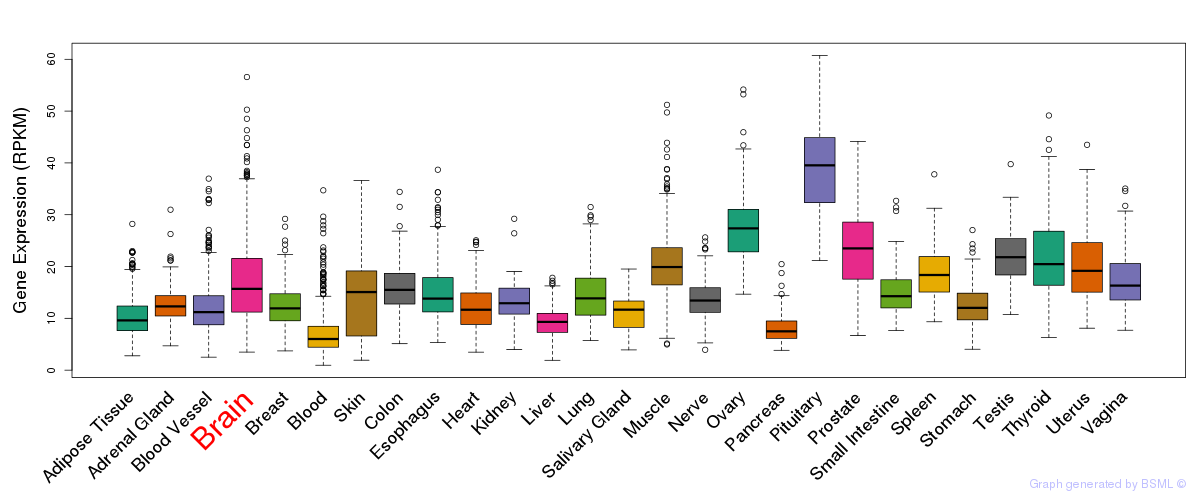
General gene expression (GTEx)
Gene expression during devlopment (BrainCloud)
Footnote:
A total of 269 time points ploted, with n=38 fetal samples (x=1:38). Each triangle represents one time point.
Gene expression of temporal and spatial changes (BrainSpan)
Footnote:
SC: sub-cortical regions; SM: sensory-motor regions; FC: frontal cortex; and TP: temporal-parietal cortex
ST1: fetal (13 - 26 postconception weeks), ST2: early infancy to late childhood (4 months to 11 years), and ST3: adolescence to adulthood (13 - 23 years)
The bar shown representes the lower 25% and upper 25% of the expression distribution.
No co-expressed genes in brain regions
Section V. Pathway annotation
| Pathway name | Pathway size | # SZGR 2.0 genes in pathway | Info |
|---|---|---|---|
| REACTOME ACTIVATED NOTCH1 TRANSMITS SIGNAL TO THE NUCLEUS | 27 | 18 | All SZGR 2.0 genes in this pathway |
| REACTOME SIGNALING BY NOTCH1 | 70 | 46 | All SZGR 2.0 genes in this pathway |
| REACTOME SIGNALING BY NOTCH | 103 | 64 | All SZGR 2.0 genes in this pathway |
| DODD NASOPHARYNGEAL CARCINOMA UP | 1821 | 933 | All SZGR 2.0 genes in this pathway |
| RODRIGUES THYROID CARCINOMA POORLY DIFFERENTIATED DN | 805 | 505 | All SZGR 2.0 genes in this pathway |
| LASTOWSKA NEUROBLASTOMA COPY NUMBER DN | 800 | 473 | All SZGR 2.0 genes in this pathway |
| PEREZ TP53 TARGETS | 1174 | 695 | All SZGR 2.0 genes in this pathway |
| GRADE COLON CANCER UP | 871 | 505 | All SZGR 2.0 genes in this pathway |
| WAKABAYASHI ADIPOGENESIS PPARG BOUND 8D | 658 | 397 | All SZGR 2.0 genes in this pathway |
| PEDRIOLI MIR31 TARGETS DN | 418 | 245 | All SZGR 2.0 genes in this pathway |
| RATTENBACHER BOUND BY CELF1 | 467 | 251 | All SZGR 2.0 genes in this pathway |
| RAO BOUND BY SALL4 | 227 | 149 | All SZGR 2.0 genes in this pathway |