Gene Page: ZFP90
Summary ?
| GeneID | 146198 |
| Symbol | ZFP90 |
| Synonyms | FIK|NK10|ZNF756|zfp-90 |
| Description | ZFP90 zinc finger protein |
| Reference | MIM:609451|HGNC:HGNC:23329|Ensembl:ENSG00000184939|HPRD:18729|Vega:OTTHUMG00000177312 |
| Gene type | protein-coding |
| Map location | 16q22.1 |
| Pascal p-value | 0.187 |
| Fetal beta | 1.053 |
| DMG | 1 (# studies) |
| eGene | Anterior cingulate cortex BA24 Caudate basal ganglia Cortex Frontal Cortex BA9 Nucleus accumbens basal ganglia |
Gene in Data Sources
| Gene set name | Method of gene set | Description | Info |
|---|---|---|---|
| CV:GWAScat | Genome-wide Association Studies | This data set includes 560 SNPs associated with schizophrenia. A total of 486 genes were mapped to these SNPs within 50kb. | |
| CV:GWASdb | Genome-wide Association Studies | GWASdb records for schizophrenia | |
| CV:PGCnp | Genome-wide Association Study | GWAS | |
| DMG:vanEijk_2014 | Genome-wide DNA methylation analysis | This dataset includes 432 differentially methylated CpG sites corresponding to 391 unique transcripts between schizophrenia patients (n=260) and unaffected controls (n=250). | 1 |
Section I. Genetics and epigenetics annotation
 Differentially methylated gene
| Probe | Chromosome | Position | Nearest gene | P (dis) | Beta (dis) | FDR (dis) | Study |
|---|---|---|---|---|---|---|---|
| cg19297232 | 16 | 68483021 | ZFP90 | 6.233E-4 | -3.667 | DMG:vanEijk_2014 |
eQTL annotation
| SNP ID | Chromosome | Position | eGene | Gene Entrez ID | pvalue | qvalue | TSS distance | eQTL type |
|---|---|---|---|---|---|---|---|---|
| rs820799 | 16 | 68559537 | ZFP90 | ENSG00000184939.11 | 7.327E-9 | 0 | -4456 | gtex_brain_ba24 |
| rs698713 | 16 | 68561240 | ZFP90 | ENSG00000184939.11 | 9.637E-9 | 0 | -2753 | gtex_brain_ba24 |
| rs71395863 | 16 | 68563358 | ZFP90 | ENSG00000184939.11 | 5.193E-6 | 0 | -635 | gtex_brain_ba24 |
| rs1645933 | 16 | 68567169 | ZFP90 | ENSG00000184939.11 | 5.894E-6 | 0 | 3176 | gtex_brain_ba24 |
| rs1728786 | 16 | 68569706 | ZFP90 | ENSG00000184939.11 | 2.154E-9 | 0 | 5713 | gtex_brain_ba24 |
| rs1645926 | 16 | 68571225 | ZFP90 | ENSG00000184939.11 | 6.967E-6 | 0 | 7232 | gtex_brain_ba24 |
| rs1645980 | 16 | 68571619 | ZFP90 | ENSG00000184939.11 | 2.106E-9 | 0 | 7626 | gtex_brain_ba24 |
| rs1645981 | 16 | 68571648 | ZFP90 | ENSG00000184939.11 | 6.988E-6 | 0 | 7655 | gtex_brain_ba24 |
| rs1182967 | 16 | 68574378 | ZFP90 | ENSG00000184939.11 | 1.63E-8 | 0 | 10385 | gtex_brain_ba24 |
| rs2477623 | 16 | 68575176 | ZFP90 | ENSG00000184939.11 | 3.281E-6 | 0 | 11183 | gtex_brain_ba24 |
| rs821166 | 16 | 68578481 | ZFP90 | ENSG00000184939.11 | 2.189E-9 | 0 | 14488 | gtex_brain_ba24 |
| rs1094281 | 16 | 68579038 | ZFP90 | ENSG00000184939.11 | 4.19E-6 | 0 | 15045 | gtex_brain_ba24 |
| rs12921494 | 16 | 68582861 | ZFP90 | ENSG00000184939.11 | 3.479E-9 | 0 | 18868 | gtex_brain_ba24 |
| rs11642045 | 16 | 68583892 | ZFP90 | ENSG00000184939.11 | 6.797E-6 | 0 | 19899 | gtex_brain_ba24 |
| rs7195656 | 16 | 68586791 | ZFP90 | ENSG00000184939.11 | 1.678E-9 | 0 | 22798 | gtex_brain_ba24 |
| rs1645929 | 16 | 68591350 | ZFP90 | ENSG00000184939.11 | 1.667E-9 | 0 | 27357 | gtex_brain_ba24 |
| rs1645937 | 16 | 68593844 | ZFP90 | ENSG00000184939.11 | 1.433E-9 | 0 | 29851 | gtex_brain_ba24 |
| rs1728790 | 16 | 68596308 | ZFP90 | ENSG00000184939.11 | 2.132E-9 | 0 | 32315 | gtex_brain_ba24 |
| rs1728791 | 16 | 68596509 | ZFP90 | ENSG00000184939.11 | 1.665E-9 | 0 | 32516 | gtex_brain_ba24 |
| rs12929568 | 16 | 68596689 | ZFP90 | ENSG00000184939.11 | 5.369E-6 | 0 | 32696 | gtex_brain_ba24 |
| rs1177648 | 16 | 68598007 | ZFP90 | ENSG00000184939.11 | 2.105E-9 | 0 | 34014 | gtex_brain_ba24 |
| rs7499785 | 16 | 68601285 | ZFP90 | ENSG00000184939.11 | 1.664E-9 | 0 | 37292 | gtex_brain_ba24 |
| rs1728793 | 16 | 68602693 | ZFP90 | ENSG00000184939.11 | 2.344E-8 | 0 | 38700 | gtex_brain_ba24 |
| rs1177647 | 16 | 68603756 | ZFP90 | ENSG00000184939.11 | 1.181E-8 | 0 | 39763 | gtex_brain_ba24 |
| rs1170435 | 16 | 68607398 | ZFP90 | ENSG00000184939.11 | 2.235E-9 | 0 | 43405 | gtex_brain_ba24 |
| rs71975423 | 16 | 68607904 | ZFP90 | ENSG00000184939.11 | 2.633E-8 | 0 | 43911 | gtex_brain_ba24 |
| rs1094284 | 16 | 68631592 | ZFP90 | ENSG00000184939.11 | 5.846E-6 | 0 | 67599 | gtex_brain_ba24 |
| rs1094283 | 16 | 68632174 | ZFP90 | ENSG00000184939.11 | 5.881E-6 | 0 | 68181 | gtex_brain_ba24 |
| rs71148919 | 16 | 68633216 | ZFP90 | ENSG00000184939.11 | 5.945E-6 | 0 | 69223 | gtex_brain_ba24 |
| rs1170421 | 16 | 68635336 | ZFP90 | ENSG00000184939.11 | 2.842E-6 | 0 | 71343 | gtex_brain_ba24 |
| rs398029790 | 16 | 68644267 | ZFP90 | ENSG00000184939.11 | 3.395E-6 | 0 | 80274 | gtex_brain_ba24 |
| rs12919811 | 16 | 68655278 | ZFP90 | ENSG00000184939.11 | 4.585E-6 | 0 | 91285 | gtex_brain_ba24 |
Section II. Transcriptome annotation
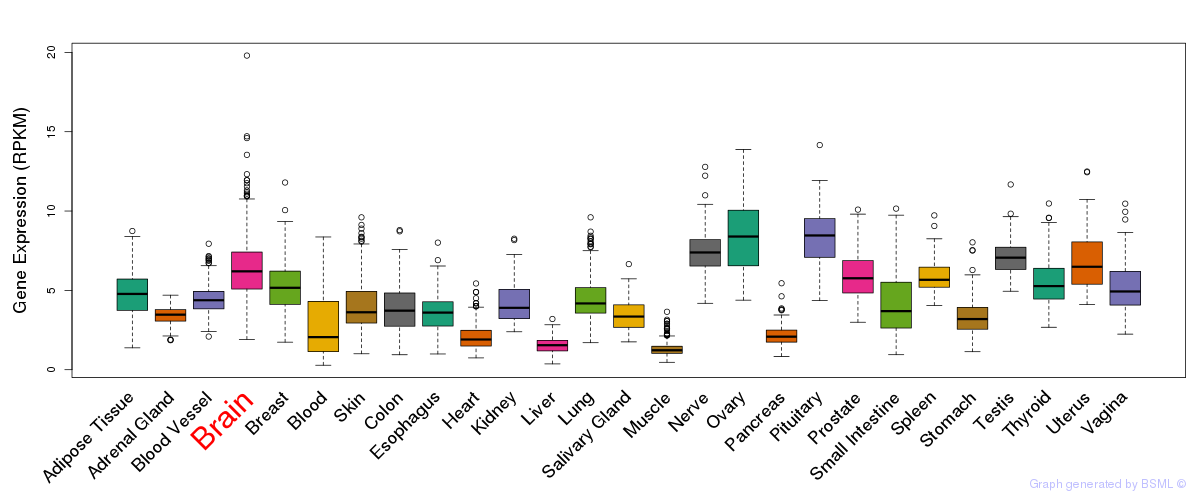
General gene expression (GTEx)
Gene expression during devlopment (BrainCloud)
Footnote:
A total of 269 time points ploted, with n=38 fetal samples (x=1:38). Each triangle represents one time point.
Gene expression of temporal and spatial changes (BrainSpan)
Footnote:
SC: sub-cortical regions; SM: sensory-motor regions; FC: frontal cortex; and TP: temporal-parietal cortex
ST1: fetal (13 - 26 postconception weeks), ST2: early infancy to late childhood (4 months to 11 years), and ST3: adolescence to adulthood (13 - 23 years)
The bar shown representes the lower 25% and upper 25% of the expression distribution.
No co-expressed genes in brain regions
Section V. Pathway annotation
| Pathway name | Pathway size | # SZGR 2.0 genes in pathway | Info |
|---|---|---|---|
| REACTOME GENERIC TRANSCRIPTION PATHWAY | 352 | 181 | All SZGR 2.0 genes in this pathway |
| GRAESSMANN APOPTOSIS BY DOXORUBICIN DN | 1781 | 1082 | All SZGR 2.0 genes in this pathway |
| BERENJENO TRANSFORMED BY RHOA DN | 394 | 258 | All SZGR 2.0 genes in this pathway |
| PEREZ TP53 TARGETS | 1174 | 695 | All SZGR 2.0 genes in this pathway |
| HERNANDEZ ABERRANT MITOSIS BY DOCETACEL 2NM UP | 81 | 57 | All SZGR 2.0 genes in this pathway |
| GARCIA TARGETS OF FLI1 AND DAX1 UP | 57 | 34 | All SZGR 2.0 genes in this pathway |
| RICKMAN METASTASIS UP | 344 | 180 | All SZGR 2.0 genes in this pathway |
| ZHAN MULTIPLE MYELOMA CD1 AND CD2 UP | 89 | 51 | All SZGR 2.0 genes in this pathway |
| LEE AGING MUSCLE UP | 45 | 33 | All SZGR 2.0 genes in this pathway |
| MCCABE BOUND BY HOXC6 | 469 | 239 | All SZGR 2.0 genes in this pathway |
| CHEN METABOLIC SYNDROM NETWORK | 1210 | 725 | All SZGR 2.0 genes in this pathway |
| WONG ADULT TISSUE STEM MODULE | 721 | 492 | All SZGR 2.0 genes in this pathway |