Gene Page: TMEM199
Summary ?
| GeneID | 147007 |
| Symbol | TMEM199 |
| Synonyms | C17orf32|CDG2P|VMA12|VPH2 |
| Description | transmembrane protein 199 |
| Reference | MIM:616815|HGNC:HGNC:18085|Ensembl:ENSG00000244045|HPRD:12679|Vega:OTTHUMG00000132498 |
| Gene type | protein-coding |
| Map location | 17q11.2 |
| Sherlock p-value | 0.541 |
| Fetal beta | 0.611 |
| eGene | Anterior cingulate cortex BA24 Myers' cis & trans |
Gene in Data Sources
| Gene set name | Method of gene set | Description | Info |
|---|---|---|---|
| CV:GWASdb | Genome-wide Association Studies | GWASdb records for schizophrenia |
Section I. Genetics and epigenetics annotation
 eQTL annotation
| SNP ID | Chromosome | Position | eGene | Gene Entrez ID | pvalue | qvalue | TSS distance | eQTL type |
|---|---|---|---|---|---|---|---|---|
| rs10954565 | chr7 | 136560247 | TMEM199 | 147007 | 0.14 | trans | ||
| rs11080055 | 17 | 26649724 | TMEM199 | ENSG00000244045.6 | 4.21375E-7 | 0.01 | -34880 | gtex_brain_ba24 |
| rs3093692 | 17 | 26670627 | TMEM199 | ENSG00000244045.6 | 9.82612E-7 | 0.01 | -13977 | gtex_brain_ba24 |
| rs733914 | 17 | 26671196 | TMEM199 | ENSG00000244045.6 | 4.21375E-7 | 0.01 | -13408 | gtex_brain_ba24 |
| rs13469 | 17 | 26676135 | TMEM199 | ENSG00000244045.6 | 1.90612E-6 | 0.01 | -8469 | gtex_brain_ba24 |
| rs2073867 | 17 | 26678960 | TMEM199 | ENSG00000244045.6 | 4.21375E-7 | 0.01 | -5644 | gtex_brain_ba24 |
| rs708100 | 17 | 26688663 | TMEM199 | ENSG00000244045.6 | 4.21375E-7 | 0.01 | 4059 | gtex_brain_ba24 |
| rs704 | 17 | 26694861 | TMEM199 | ENSG00000244045.6 | 1.42483E-6 | 0.01 | 10257 | gtex_brain_ba24 |
| rs7212510 | 17 | 26703682 | TMEM199 | ENSG00000244045.6 | 2.16525E-6 | 0.01 | 19078 | gtex_brain_ba24 |
Section II. Transcriptome annotation
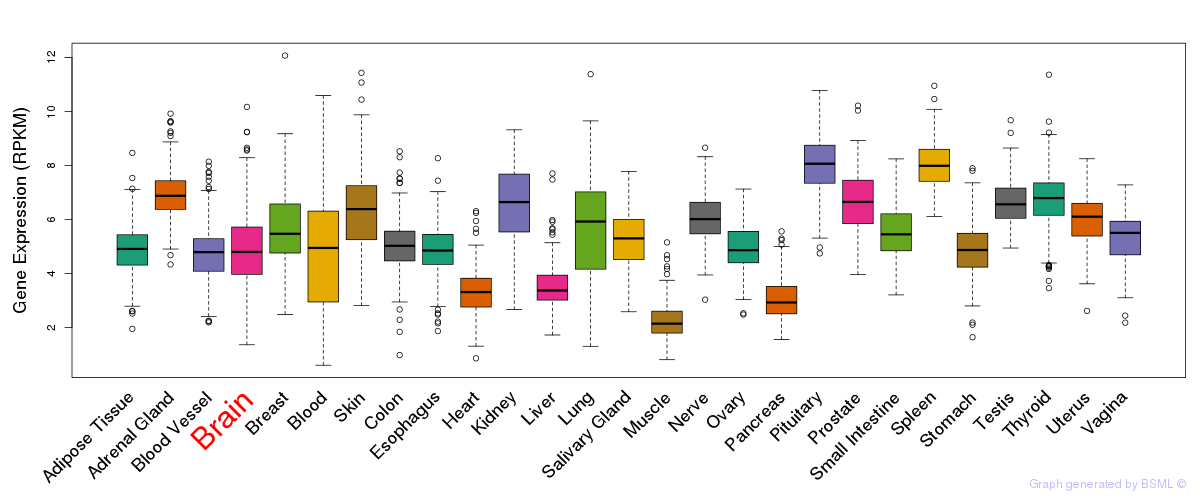
General gene expression (GTEx)
Gene expression during devlopment (BrainCloud)
Footnote:
A total of 269 time points ploted, with n=38 fetal samples (x=1:38). Each triangle represents one time point.
Gene expression of temporal and spatial changes (BrainSpan)
Footnote:
SC: sub-cortical regions; SM: sensory-motor regions; FC: frontal cortex; and TP: temporal-parietal cortex
ST1: fetal (13 - 26 postconception weeks), ST2: early infancy to late childhood (4 months to 11 years), and ST3: adolescence to adulthood (13 - 23 years)
The bar shown representes the lower 25% and upper 25% of the expression distribution.
No co-expressed genes in brain regions
Section V. Pathway annotation
| Pathway name | Pathway size | # SZGR 2.0 genes in pathway | Info |
|---|---|---|---|
| WANG LMO4 TARGETS DN | 352 | 225 | All SZGR 2.0 genes in this pathway |
| LASTOWSKA NEUROBLASTOMA COPY NUMBER UP | 181 | 108 | All SZGR 2.0 genes in this pathway |
| BYSTRYKH HEMATOPOIESIS STEM CELL QTL TRANS | 882 | 572 | All SZGR 2.0 genes in this pathway |
| CREIGHTON ENDOCRINE THERAPY RESISTANCE 5 | 482 | 296 | All SZGR 2.0 genes in this pathway |
| MARSON BOUND BY FOXP3 UNSTIMULATED | 1229 | 713 | All SZGR 2.0 genes in this pathway |
| MASSARWEH TAMOXIFEN RESISTANCE UP | 578 | 341 | All SZGR 2.0 genes in this pathway |
| ACEVEDO LIVER CANCER UP | 973 | 570 | All SZGR 2.0 genes in this pathway |
| ACEVEDO LIVER TUMOR VS NORMAL ADJACENT TISSUE UP | 863 | 514 | All SZGR 2.0 genes in this pathway |
| ALONSO METASTASIS UP | 198 | 128 | All SZGR 2.0 genes in this pathway |
| CHANDRAN METASTASIS DN | 306 | 191 | All SZGR 2.0 genes in this pathway |
| LEE BMP2 TARGETS DN | 882 | 538 | All SZGR 2.0 genes in this pathway |