Gene Page: CTSL
Summary ?
| GeneID | 1514 |
| Symbol | CTSL |
| Synonyms | CATL|CTSL1|MEP |
| Description | cathepsin L |
| Reference | MIM:116880|HGNC:HGNC:2537|Ensembl:ENSG00000135047|HPRD:00293|Vega:OTTHUMG00000020149 |
| Gene type | protein-coding |
| Map location | 9q21.33 |
| DMG | 1 (# studies) |
Gene in Data Sources
| Gene set name | Method of gene set | Description | Info |
|---|---|---|---|
| CV:PGCnp | Genome-wide Association Study | GWAS | |
| DMG:Nishioka_2013 | Genome-wide DNA methylation analysis | The authors investigated the methylation profiles of DNA in peripheral blood cells from 18 patients with first-episode schizophrenia (FESZ) and from 15 normal controls. | 1 |
Section I. Genetics and epigenetics annotation
 Differentially methylated gene
| Probe | Chromosome | Position | Nearest gene | P (dis) | Beta (dis) | FDR (dis) | Study |
|---|---|---|---|---|---|---|---|
| cg15242570 | 9 | 90341048 | CTSL | -0.048 | 0.33 | DMG:Nishioka_2013 |
eQTL annotation
| SNP ID | Chromosome | Position | eGene | Gene Entrez ID | pvalue | qvalue | TSS distance | eQTL type |
|---|---|---|---|---|---|---|---|---|
| rs1245072 | chr1 | 70115755 | CTSL1 | 1514 | 0.2 | trans |
Section II. Transcriptome annotation
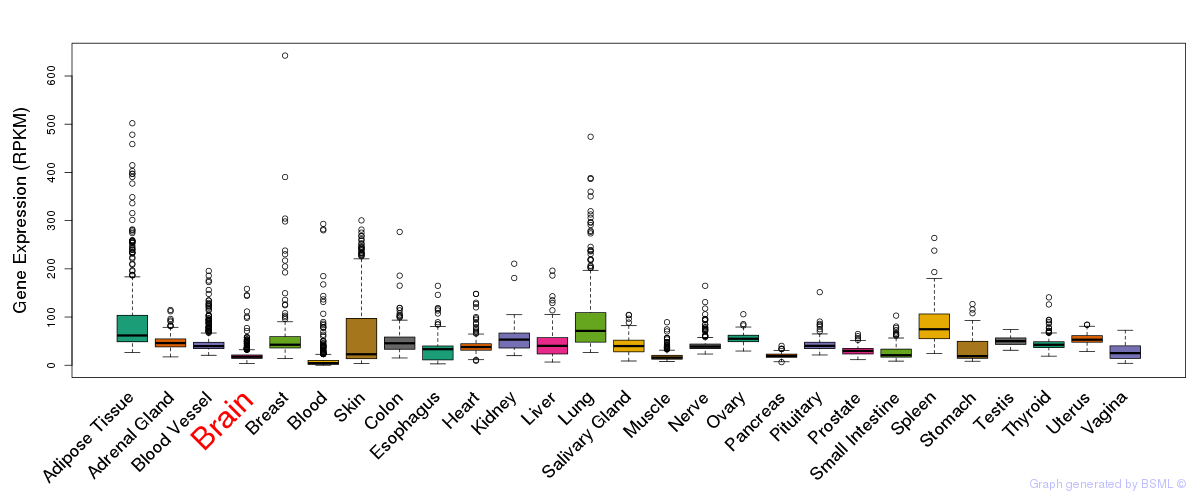
General gene expression (GTEx)
Gene expression of temporal and spatial changes (BrainSpan)
Footnote:
SC: sub-cortical regions; SM: sensory-motor regions; FC: frontal cortex; and TP: temporal-parietal cortex
ST1: fetal (13 - 26 postconception weeks), ST2: early infancy to late childhood (4 months to 11 years), and ST3: adolescence to adulthood (13 - 23 years)
The bar shown representes the lower 25% and upper 25% of the expression distribution.
Top co-expressed genes in brain regions
| Top 10 positively co-expressed genes | ||
| Gene | Pearson's Correlation | Spearman's Correlation |
| PANX1 | 0.95 | 0.96 |
| PCDHA2 | 0.93 | 0.95 |
| HSDL1 | 0.93 | 0.95 |
| MFAP3 | 0.93 | 0.95 |
| GNG2 | 0.93 | 0.95 |
| CASK | 0.93 | 0.96 |
| KBTBD6 | 0.92 | 0.95 |
| WNK3 | 0.92 | 0.95 |
| PDIK1L | 0.92 | 0.95 |
| KIDINS220 | 0.92 | 0.97 |
| Top 10 negatively co-expressed genes | ||
| Gene | Pearson's Correlation | Spearman's Correlation |
| AIFM3 | -0.69 | -0.79 |
| HLA-F | -0.69 | -0.79 |
| C5orf53 | -0.68 | -0.76 |
| TSC22D4 | -0.67 | -0.80 |
| AF347015.27 | -0.67 | -0.87 |
| HEPN1 | -0.67 | -0.77 |
| S100B | -0.67 | -0.84 |
| AF347015.31 | -0.67 | -0.88 |
| AC018755.7 | -0.67 | -0.75 |
| ALDOC | -0.66 | -0.72 |
Section V. Pathway annotation
| Pathway name | Pathway size | # SZGR 2.0 genes in pathway | Info |
|---|---|---|---|
| NABA ECM REGULATORS | 238 | 125 | All SZGR 2.0 genes in this pathway |
| NABA MATRISOME ASSOCIATED | 753 | 411 | All SZGR 2.0 genes in this pathway |
| NABA MATRISOME | 1028 | 559 | All SZGR 2.0 genes in this pathway |