Gene Page: RNF145
Summary ?
| GeneID | 153830 |
| Symbol | RNF145 |
| Synonyms | - |
| Description | ring finger protein 145 |
| Reference | HGNC:HGNC:20853|Ensembl:ENSG00000145860|HPRD:08113|Vega:OTTHUMG00000130306 |
| Gene type | protein-coding |
| Map location | 5q33.3 |
| Pascal p-value | 7.397E-5 |
| Sherlock p-value | 0.009 |
| Fetal beta | 0.528 |
| eGene | Myers' cis & trans |
Gene in Data Sources
| Gene set name | Method of gene set | Description | Info |
|---|---|---|---|
| CV:PGCnp | Genome-wide Association Study | GWAS | |
| GSMA_I | Genome scan meta-analysis | Psr: 0.0032 | |
| GSMA_IIE | Genome scan meta-analysis (European-ancestry samples) | Psr: 0.01718 | |
| GSMA_IIA | Genome scan meta-analysis (All samples) | Psr: 0.00459 |
Section I. Genetics and epigenetics annotation
 eQTL annotation
| SNP ID | Chromosome | Position | eGene | Gene Entrez ID | pvalue | qvalue | TSS distance | eQTL type |
|---|---|---|---|---|---|---|---|---|
| rs17788483 | chr20 | 49379810 | RNF145 | 153830 | 0.17 | trans |
Section II. Transcriptome annotation
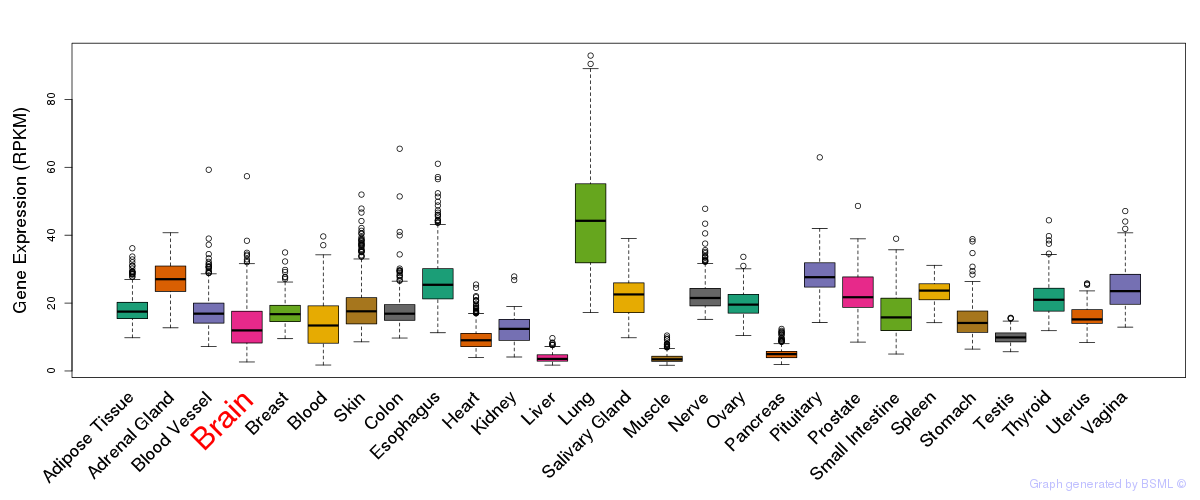
General gene expression (GTEx)
Gene expression during devlopment (BrainCloud)
Footnote:
A total of 269 time points ploted, with n=38 fetal samples (x=1:38). Each triangle represents one time point.
Gene expression of temporal and spatial changes (BrainSpan)
Footnote:
SC: sub-cortical regions; SM: sensory-motor regions; FC: frontal cortex; and TP: temporal-parietal cortex
ST1: fetal (13 - 26 postconception weeks), ST2: early infancy to late childhood (4 months to 11 years), and ST3: adolescence to adulthood (13 - 23 years)
The bar shown representes the lower 25% and upper 25% of the expression distribution.
No co-expressed genes in brain regions
Section III. Gene Ontology annotation
| Molecular function | GO term | Evidence | Neuro keywords | PubMed ID |
|---|---|---|---|---|
| GO:0005515 | protein binding | IEA | - | |
| GO:0008270 | zinc ion binding | IEA | - | |
| GO:0046872 | metal ion binding | IEA | - | |
| Cellular component | GO term | Evidence | Neuro keywords | PubMed ID |
| GO:0016020 | membrane | IEA | - | |
| GO:0016021 | integral to membrane | IEA | - |
Section V. Pathway annotation
| Pathway name | Pathway size | # SZGR 2.0 genes in pathway | Info |
|---|---|---|---|
| CORRE MULTIPLE MYELOMA UP | 74 | 45 | All SZGR 2.0 genes in this pathway |
| CHARAFE BREAST CANCER LUMINAL VS BASAL DN | 455 | 304 | All SZGR 2.0 genes in this pathway |
| CHARAFE BREAST CANCER LUMINAL VS MESENCHYMAL DN | 460 | 312 | All SZGR 2.0 genes in this pathway |
| GARGALOVIC RESPONSE TO OXIDIZED PHOSPHOLIPIDS YELLOW DN | 23 | 15 | All SZGR 2.0 genes in this pathway |
| GARGALOVIC RESPONSE TO OXIDIZED PHOSPHOLIPIDS GREEN DN | 25 | 12 | All SZGR 2.0 genes in this pathway |
| GRAESSMANN APOPTOSIS BY DOXORUBICIN DN | 1781 | 1082 | All SZGR 2.0 genes in this pathway |
| LIAO METASTASIS | 539 | 324 | All SZGR 2.0 genes in this pathway |
| RAMALHO STEMNESS UP | 206 | 118 | All SZGR 2.0 genes in this pathway |
| DOUGLAS BMI1 TARGETS UP | 566 | 371 | All SZGR 2.0 genes in this pathway |
| CREIGHTON ENDOCRINE THERAPY RESISTANCE 3 | 720 | 440 | All SZGR 2.0 genes in this pathway |
| SARRIO EPITHELIAL MESENCHYMAL TRANSITION DN | 154 | 101 | All SZGR 2.0 genes in this pathway |
| TOYOTA TARGETS OF MIR34B AND MIR34C | 463 | 262 | All SZGR 2.0 genes in this pathway |
| VANTVEER BREAST CANCER ESR1 DN | 240 | 153 | All SZGR 2.0 genes in this pathway |
| ZHANG TLX TARGETS 36HR UP | 221 | 150 | All SZGR 2.0 genes in this pathway |
| ZHANG TLX TARGETS 60HR UP | 293 | 203 | All SZGR 2.0 genes in this pathway |
| ZHANG TLX TARGETS UP | 108 | 78 | All SZGR 2.0 genes in this pathway |
| CHICAS RB1 TARGETS LOW SERUM | 100 | 51 | All SZGR 2.0 genes in this pathway |
| PILON KLF1 TARGETS DN | 1972 | 1213 | All SZGR 2.0 genes in this pathway |
Section VI. microRNA annotation
| miRNA family | Target position | miRNA ID | miRNA seq | ||
|---|---|---|---|---|---|
| UTR start | UTR end | Match method | |||
| miR-1/206 | 111 | 118 | 1A,m8 | hsa-miR-1 | UGGAAUGUAAAGAAGUAUGUA |
| hsa-miR-206SZ | UGGAAUGUAAGGAAGUGUGUGG | ||||
| hsa-miR-613 | AGGAAUGUUCCUUCUUUGCC | ||||
| miR-130/301 | 910 | 916 | m8 | hsa-miR-130abrain | CAGUGCAAUGUUAAAAGGGCAU |
| hsa-miR-301 | CAGUGCAAUAGUAUUGUCAAAGC | ||||
| hsa-miR-130bbrain | CAGUGCAAUGAUGAAAGGGCAU | ||||
| hsa-miR-454-3p | UAGUGCAAUAUUGCUUAUAGGGUUU | ||||
| miR-141/200a | 888 | 895 | 1A,m8 | hsa-miR-141 | UAACACUGUCUGGUAAAGAUGG |
| hsa-miR-200a | UAACACUGUCUGGUAACGAUGU | ||||
| miR-181 | 1229 | 1235 | m8 | hsa-miR-181abrain | AACAUUCAACGCUGUCGGUGAGU |
| hsa-miR-181bSZ | AACAUUCAUUGCUGUCGGUGGG | ||||
| hsa-miR-181cbrain | AACAUUCAACCUGUCGGUGAGU | ||||
| hsa-miR-181dbrain | AACAUUCAUUGUUGUCGGUGGGUU | ||||
| miR-19 | 909 | 915 | m8 | hsa-miR-19a | UGUGCAAAUCUAUGCAAAACUGA |
| hsa-miR-19b | UGUGCAAAUCCAUGCAAAACUGA | ||||
| miR-208 | 1234 | 1240 | 1A | hsa-miR-208 | AUAAGACGAGCAAAAAGCUUGU |
| miR-223 | 1214 | 1220 | 1A | hsa-miR-223 | UGUCAGUUUGUCAAAUACCCC |
| miR-362 | 1001 | 1007 | m8 | hsa-miR-362 | AAUCCUUGGAACCUAGGUGUGAGU |
| miR-377 | 739 | 746 | 1A,m8 | hsa-miR-377 | AUCACACAAAGGCAACUUUUGU |
| miR-409-3p | 1027 | 1033 | 1A | hsa-miR-409-3p | CGAAUGUUGCUCGGUGAACCCCU |
| miR-485-3p | 936 | 942 | m8 | hsa-miR-485-3p | GUCAUACACGGCUCUCCUCUCU |
| miR-495 | 709 | 715 | 1A | hsa-miR-495brain | AAACAAACAUGGUGCACUUCUUU |
| miR-499 | 1234 | 1240 | 1A | hsa-miR-499 | UUAAGACUUGCAGUGAUGUUUAA |
- SZ: miRNAs which differentially expressed in brain cortex of schizophrenia patients comparing with control samples using microarray. Click here to see the list of SZ related miRNAs.
- Brain: miRNAs which are expressed in brain based on miRNA microarray expression studies. Click here to see the list of brain related miRNAs.