Gene Page: DEDD2
Summary ?
| GeneID | 162989 |
| Symbol | DEDD2 |
| Synonyms | FLAME-3 |
| Description | death effector domain containing 2 |
| Reference | HGNC:HGNC:24450|Ensembl:ENSG00000160570|HPRD:10868|Vega:OTTHUMG00000182763 |
| Gene type | protein-coding |
| Map location | 19q13.2 |
| Pascal p-value | 0.127 |
| Sherlock p-value | 0.884 |
| Fetal beta | -0.449 |
| DMG | 2 (# studies) |
| eGene | Myers' cis & trans |
Gene in Data Sources
| Gene set name | Method of gene set | Description | Info |
|---|---|---|---|
| CV:PGCnp | Genome-wide Association Study | GWAS | |
| DMG:Jaffe_2016 | Genome-wide DNA methylation analysis | This dataset includes 2,104 probes/CpGs associated with SZ patients (n=108) compared to 136 controls at Bonferroni-adjusted P < 0.05. | 2 |
| DMG:vanEijk_2014 | Genome-wide DNA methylation analysis | This dataset includes 432 differentially methylated CpG sites corresponding to 391 unique transcripts between schizophrenia patients (n=260) and unaffected controls (n=250). | 2 |
Section I. Genetics and epigenetics annotation
 Differentially methylated gene
| Probe | Chromosome | Position | Nearest gene | P (dis) | Beta (dis) | FDR (dis) | Study |
|---|---|---|---|---|---|---|---|
| cg22968175 | 19 | 42721878 | DEDD2 | 1.41E-9 | -0.027 | 1.38E-6 | DMG:Jaffe_2016 |
| cg21126943 | 19 | 42259395 | DEDD2 | 5.1E-5 | -3.52 | DMG:vanEijk_2014 |
eQTL annotation
| SNP ID | Chromosome | Position | eGene | Gene Entrez ID | pvalue | qvalue | TSS distance | eQTL type |
|---|---|---|---|---|---|---|---|---|
| rs17022908 | chr2 | 38783057 | DEDD2 | 162989 | 0.2 | trans | ||
| rs11884118 | chr2 | 47268112 | DEDD2 | 162989 | 0.14 | trans | ||
| rs12829851 | chr12 | 53125144 | DEDD2 | 162989 | 0.13 | trans | ||
| rs1053733 | chr17 | 43183027 | DEDD2 | 162989 | 0.17 | trans | ||
| rs7249844 | chr19 | 29228262 | DEDD2 | 162989 | 0.1 | trans | ||
| rs4805270 | chr19 | 29309693 | DEDD2 | 162989 | 0.03 | trans |
Section II. Transcriptome annotation
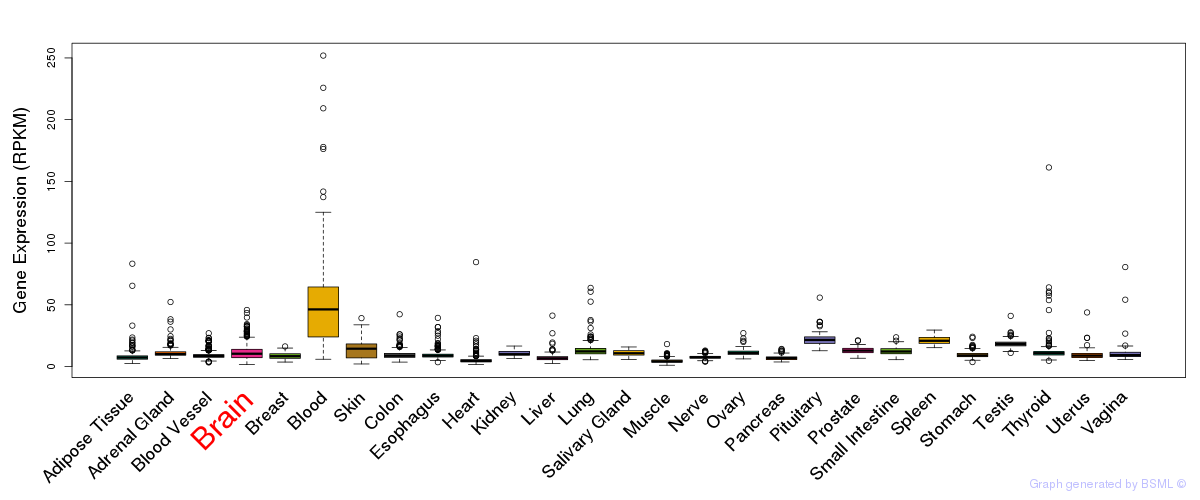
General gene expression (GTEx)
Gene expression during devlopment (BrainCloud)
Footnote:
A total of 269 time points ploted, with n=38 fetal samples (x=1:38). Each triangle represents one time point.
Gene expression of temporal and spatial changes (BrainSpan)
Footnote:
SC: sub-cortical regions; SM: sensory-motor regions; FC: frontal cortex; and TP: temporal-parietal cortex
ST1: fetal (13 - 26 postconception weeks), ST2: early infancy to late childhood (4 months to 11 years), and ST3: adolescence to adulthood (13 - 23 years)
The bar shown representes the lower 25% and upper 25% of the expression distribution.
No co-expressed genes in brain regions
Section V. Pathway annotation
| Pathway name | Pathway size | # SZGR 2.0 genes in pathway | Info |
|---|---|---|---|
| ST FAS SIGNALING PATHWAY | 65 | 54 | All SZGR 2.0 genes in this pathway |
| ZHOU INFLAMMATORY RESPONSE LIVE DN | 384 | 220 | All SZGR 2.0 genes in this pathway |
| NOJIMA SFRP2 TARGETS UP | 31 | 23 | All SZGR 2.0 genes in this pathway |
| OSMAN BLADDER CANCER DN | 406 | 230 | All SZGR 2.0 genes in this pathway |
| GARGALOVIC RESPONSE TO OXIDIZED PHOSPHOLIPIDS BLUE UP | 136 | 80 | All SZGR 2.0 genes in this pathway |
| RODRIGUES THYROID CARCINOMA POORLY DIFFERENTIATED DN | 805 | 505 | All SZGR 2.0 genes in this pathway |
| PEREZ TP53 TARGETS | 1174 | 695 | All SZGR 2.0 genes in this pathway |
| PEREZ TP63 TARGETS | 355 | 243 | All SZGR 2.0 genes in this pathway |
| PEREZ TP53 AND TP63 TARGETS | 205 | 145 | All SZGR 2.0 genes in this pathway |
| KOYAMA SEMA3B TARGETS UP | 292 | 168 | All SZGR 2.0 genes in this pathway |
| IVANOVA HEMATOPOIESIS MATURE CELL | 293 | 160 | All SZGR 2.0 genes in this pathway |