Gene Page: DNASE1L2
Summary ?
| GeneID | 1775 |
| Symbol | DNASE1L2 |
| Synonyms | DNAS1L2 |
| Description | deoxyribonuclease I-like 2 |
| Reference | MIM:602622|HGNC:HGNC:2958|Ensembl:ENSG00000167968|HPRD:04018|Vega:OTTHUMG00000177086 |
| Gene type | protein-coding |
| Map location | 16p13.3 |
| Pascal p-value | 0.436 |
| Fetal beta | 0.255 |
| eGene | Myers' cis & trans |
| Support | CompositeSet |
Gene in Data Sources
| Gene set name | Method of gene set | Description | Info |
|---|---|---|---|
| DNM:Fromer_2014 | Whole Exome Sequencing analysis | This study reported a WES study of 623 schizophrenia trios, reporting DNMs using genomic DNA. |
Section I. Genetics and epigenetics annotation
 DNM table
| Gene | Chromosome | Position | Ref | Alt | Transcript | AA change | Mutation type | Sift | CG46 | Trait | Study |
|---|---|---|---|---|---|---|---|---|---|---|---|
| DNASE1L2 | chr16 | 2287532 | C | T | NM_001374 | p.158P>L | missense | Schizophrenia | DNM:Fromer_2014 |
eQTL annotation
| SNP ID | Chromosome | Position | eGene | Gene Entrez ID | pvalue | qvalue | TSS distance | eQTL type |
|---|---|---|---|---|---|---|---|---|
| snp_a-2054853 | 0 | DNASE1L2 | 1775 | 0.1 | trans | |||
| rs10026915 | chr4 | 57857770 | DNASE1L2 | 1775 | 0.04 | trans |
Section II. Transcriptome annotation
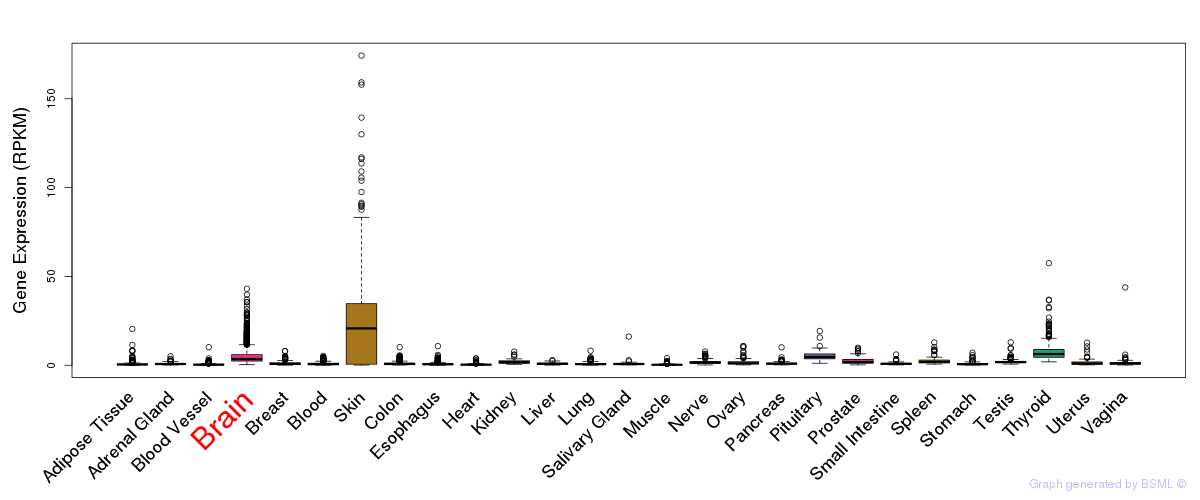
General gene expression (GTEx)
Gene expression during devlopment (BrainCloud)
Footnote:
A total of 269 time points ploted, with n=38 fetal samples (x=1:38). Each triangle represents one time point.
Gene expression of temporal and spatial changes (BrainSpan)
Footnote:
SC: sub-cortical regions; SM: sensory-motor regions; FC: frontal cortex; and TP: temporal-parietal cortex
ST1: fetal (13 - 26 postconception weeks), ST2: early infancy to late childhood (4 months to 11 years), and ST3: adolescence to adulthood (13 - 23 years)
The bar shown representes the lower 25% and upper 25% of the expression distribution.
Top co-expressed genes in brain regions
| Top 10 positively co-expressed genes | ||
| Gene | Pearson's Correlation | Spearman's Correlation |
| ZNF649 | 0.89 | 0.84 |
| RBBP4 | 0.88 | 0.85 |
| BBS9 | 0.87 | 0.86 |
| MCPH1 | 0.87 | 0.85 |
| ERCC8 | 0.87 | 0.86 |
| XRCC5 | 0.86 | 0.85 |
| G2E3 | 0.86 | 0.86 |
| INTS7 | 0.86 | 0.84 |
| PRPF40A | 0.86 | 0.85 |
| PHF16 | 0.86 | 0.80 |
| Top 10 negatively co-expressed genes | ||
| Gene | Pearson's Correlation | Spearman's Correlation |
| PTH1R | -0.59 | -0.68 |
| SLC9A3R2 | -0.58 | -0.57 |
| AF347015.27 | -0.57 | -0.73 |
| HLA-F | -0.57 | -0.66 |
| TNFSF12 | -0.57 | -0.61 |
| MT-CO2 | -0.57 | -0.75 |
| AF347015.31 | -0.57 | -0.74 |
| AF347015.33 | -0.56 | -0.73 |
| AIFM3 | -0.56 | -0.65 |
| C5orf53 | -0.56 | -0.61 |
Section V. Pathway annotation
| Pathway name | Pathway size | # SZGR 2.0 genes in pathway | Info |
|---|---|---|---|
| ENK UV RESPONSE EPIDERMIS DN | 508 | 354 | All SZGR 2.0 genes in this pathway |
| PEREZ TP53 TARGETS | 1174 | 695 | All SZGR 2.0 genes in this pathway |
| SCHAEFFER PROSTATE DEVELOPMENT 48HR UP | 487 | 286 | All SZGR 2.0 genes in this pathway |
| STONER ESOPHAGEAL CARCINOGENESIS UP | 39 | 25 | All SZGR 2.0 genes in this pathway |
| BANDRES RESPONSE TO CARMUSTIN MGMT 48HR DN | 161 | 105 | All SZGR 2.0 genes in this pathway |
| BONOME OVARIAN CANCER SURVIVAL SUBOPTIMAL DEBULKING | 510 | 309 | All SZGR 2.0 genes in this pathway |
| QI PLASMACYTOMA UP | 259 | 185 | All SZGR 2.0 genes in this pathway |
| BYSTRYKH HEMATOPOIESIS STEM CELL SCP2 QTL TRANS | 25 | 13 | All SZGR 2.0 genes in this pathway |
| YAO TEMPORAL RESPONSE TO PROGESTERONE CLUSTER 15 | 35 | 23 | All SZGR 2.0 genes in this pathway |
| MARTENS TRETINOIN RESPONSE DN | 841 | 431 | All SZGR 2.0 genes in this pathway |