Gene Page: EEF1B2
Summary ?
| GeneID | 1933 |
| Symbol | EEF1B2 |
| Synonyms | EEF1B|EEF1B1|EF1B |
| Description | eukaryotic translation elongation factor 1 beta 2 |
| Reference | MIM:600655|HGNC:HGNC:3208|Ensembl:ENSG00000114942|HPRD:02804|Vega:OTTHUMG00000132891 |
| Gene type | protein-coding |
| Map location | 2q33.3 |
| Pascal p-value | 0.014 |
| Sherlock p-value | 0.369 |
| Fetal beta | 1.716 |
| DMG | 1 (# studies) |
| eGene | Myers' cis & trans |
Gene in Data Sources
| Gene set name | Method of gene set | Description | Info |
|---|---|---|---|
| CV:PGCnp | Genome-wide Association Study | GWAS | |
| DMG:Jaffe_2016 | Genome-wide DNA methylation analysis | This dataset includes 2,104 probes/CpGs associated with SZ patients (n=108) compared to 136 controls at Bonferroni-adjusted P < 0.05. | 1 |
| GSMA_IIE | Genome scan meta-analysis (European-ancestry samples) | Psr: 0.01016 | |
| GSMA_IIA | Genome scan meta-analysis (All samples) | Psr: 0.00916 | |
| Network | Shortest path distance of core genes in the Human protein-protein interaction network | Contribution to shortest path in PPI network: 0.0113 |
Section I. Genetics and epigenetics annotation
 Differentially methylated gene
| Probe | Chromosome | Position | Nearest gene | P (dis) | Beta (dis) | FDR (dis) | Study |
|---|---|---|---|---|---|---|---|
| cg06707338 | 2 | 207024452 | EEF1B2 | 2.42E-9 | -0.012 | 1.81E-6 | DMG:Jaffe_2016 |
eQTL annotation
| SNP ID | Chromosome | Position | eGene | Gene Entrez ID | pvalue | qvalue | TSS distance | eQTL type |
|---|---|---|---|---|---|---|---|---|
| rs16841037 | chr1 | 4316543 | EEF1B2 | 1933 | 0.04 | trans | ||
| rs11120206 | chr1 | 206610593 | EEF1B2 | 1933 | 0.19 | trans | ||
| rs2716736 | chr2 | 39947946 | EEF1B2 | 1933 | 0.04 | trans | ||
| rs6759186 | chr2 | 230376822 | EEF1B2 | 1933 | 0.08 | trans | ||
| rs2713946 | chr4 | 111197804 | EEF1B2 | 1933 | 0.06 | trans | ||
| rs467856 | chr5 | 3128168 | EEF1B2 | 1933 | 0.14 | trans | ||
| rs13175086 | chr5 | 174691428 | EEF1B2 | 1933 | 0 | trans | ||
| rs2016128 | chr6 | 42442743 | EEF1B2 | 1933 | 0.17 | trans | ||
| rs12255258 | chr10 | 106306927 | EEF1B2 | 1933 | 0.18 | trans | ||
| rs2397390 | chr10 | 132403765 | EEF1B2 | 1933 | 0.15 | trans | ||
| rs4275531 | chr10 | 132403792 | EEF1B2 | 1933 | 0.15 | trans | ||
| rs17570016 | chr11 | 51428309 | EEF1B2 | 1933 | 0.18 | trans | ||
| rs998923 | chr13 | 35507810 | EEF1B2 | 1933 | 0.12 | trans |
Section II. Transcriptome annotation
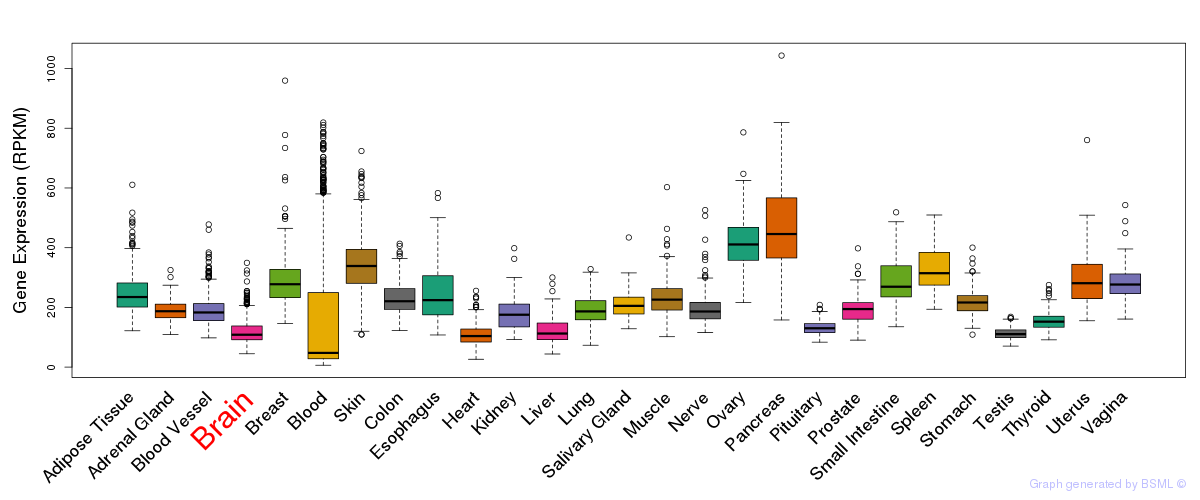
General gene expression (GTEx)
Gene expression during devlopment (BrainCloud)
Footnote:
A total of 269 time points ploted, with n=38 fetal samples (x=1:38). Each triangle represents one time point.
Gene expression of temporal and spatial changes (BrainSpan)
Footnote:
SC: sub-cortical regions; SM: sensory-motor regions; FC: frontal cortex; and TP: temporal-parietal cortex
ST1: fetal (13 - 26 postconception weeks), ST2: early infancy to late childhood (4 months to 11 years), and ST3: adolescence to adulthood (13 - 23 years)
The bar shown representes the lower 25% and upper 25% of the expression distribution.
Top co-expressed genes in brain regions
| Top 10 positively co-expressed genes | ||
| Gene | Pearson's Correlation | Spearman's Correlation |
| DSCAM | 0.81 | 0.78 |
| WASF1 | 0.81 | 0.79 |
| LMO7 | 0.80 | 0.81 |
| SSBP3 | 0.80 | 0.85 |
| TANC2 | 0.79 | 0.78 |
| KCNK9 | 0.78 | 0.81 |
| GPD1L | 0.78 | 0.79 |
| AC135352.1 | 0.78 | 0.78 |
| PRDM2 | 0.78 | 0.83 |
| SLC35F1 | 0.78 | 0.81 |
| Top 10 negatively co-expressed genes | ||
| Gene | Pearson's Correlation | Spearman's Correlation |
| SERPINB6 | -0.66 | -0.71 |
| C11orf67 | -0.61 | -0.69 |
| HSD17B14 | -0.60 | -0.67 |
| DBI | -0.60 | -0.74 |
| AF347015.31 | -0.59 | -0.65 |
| RHOC | -0.59 | -0.70 |
| MT-CO2 | -0.59 | -0.66 |
| ACSF2 | -0.58 | -0.68 |
| AF347015.21 | -0.58 | -0.70 |
| BDH2 | -0.58 | -0.64 |
Section III. Gene Ontology annotation
| Molecular function | GO term | Evidence | Neuro keywords | PubMed ID |
|---|---|---|---|---|
| GO:0003746 | translation elongation factor activity | NAS | 1886777 | |
| GO:0005515 | protein binding | IPI | 16169070 |17353931 | |
| Biological process | GO term | Evidence | Neuro keywords | PubMed ID |
| GO:0006414 | translational elongation | EXP | 15189156 | |
| GO:0006414 | translational elongation | NAS | 1886777 | |
| Cellular component | GO term | Evidence | Neuro keywords | PubMed ID |
| GO:0005829 | cytosol | EXP | 10368288 | |
| GO:0005853 | eukaryotic translation elongation factor 1 complex | NAS | 1886777 |
Section V. Pathway annotation
| Pathway name | Pathway size | # SZGR 2.0 genes in pathway | Info |
|---|---|---|---|
| REACTOME TRANSLATION | 222 | 75 | All SZGR 2.0 genes in this pathway |
| REACTOME METABOLISM OF PROTEINS | 518 | 242 | All SZGR 2.0 genes in this pathway |
| HORIUCHI WTAP TARGETS DN | 310 | 188 | All SZGR 2.0 genes in this pathway |
| OSMAN BLADDER CANCER DN | 406 | 230 | All SZGR 2.0 genes in this pathway |
| DARWICHE SKIN TUMOR PROMOTER UP | 142 | 96 | All SZGR 2.0 genes in this pathway |
| DARWICHE PAPILLOMA RISK LOW UP | 162 | 104 | All SZGR 2.0 genes in this pathway |
| DARWICHE PAPILLOMA RISK HIGH UP | 147 | 101 | All SZGR 2.0 genes in this pathway |
| DARWICHE SQUAMOUS CELL CARCINOMA UP | 146 | 104 | All SZGR 2.0 genes in this pathway |
| SCHLOSSER SERUM RESPONSE DN | 712 | 443 | All SZGR 2.0 genes in this pathway |
| PUJANA BRCA1 PCC NETWORK | 1652 | 1023 | All SZGR 2.0 genes in this pathway |
| PUJANA ATM PCC NETWORK | 1442 | 892 | All SZGR 2.0 genes in this pathway |
| PUJANA CHEK2 PCC NETWORK | 779 | 480 | All SZGR 2.0 genes in this pathway |
| RICKMAN METASTASIS UP | 344 | 180 | All SZGR 2.0 genes in this pathway |
| KUROKAWA LIVER CANCER CHEMOTHERAPY DN | 41 | 28 | All SZGR 2.0 genes in this pathway |
| POMEROY MEDULLOBLASTOMA DESMOPLASIC VS CLASSIC DN | 59 | 35 | All SZGR 2.0 genes in this pathway |
| FLECHNER PBL KIDNEY TRANSPLANT OK VS DONOR UP | 151 | 100 | All SZGR 2.0 genes in this pathway |
| KUMAR TARGETS OF MLL AF9 FUSION | 405 | 264 | All SZGR 2.0 genes in this pathway |
| ZAMORA NOS2 TARGETS UP | 69 | 41 | All SZGR 2.0 genes in this pathway |
| IVANOVA HEMATOPOIESIS INTERMEDIATE PROGENITOR | 149 | 84 | All SZGR 2.0 genes in this pathway |
| BOCHKIS FOXA2 TARGETS | 425 | 261 | All SZGR 2.0 genes in this pathway |
| CHNG MULTIPLE MYELOMA HYPERPLOID UP | 52 | 25 | All SZGR 2.0 genes in this pathway |
| SWEET LUNG CANCER KRAS UP | 491 | 316 | All SZGR 2.0 genes in this pathway |
| SWEET KRAS ONCOGENIC SIGNATURE | 89 | 56 | All SZGR 2.0 genes in this pathway |
| HSIAO HOUSEKEEPING GENES | 389 | 245 | All SZGR 2.0 genes in this pathway |
| JISON SICKLE CELL DISEASE DN | 181 | 97 | All SZGR 2.0 genes in this pathway |
| CAIRO HEPATOBLASTOMA CLASSES UP | 605 | 377 | All SZGR 2.0 genes in this pathway |
| MARTENS TRETINOIN RESPONSE DN | 841 | 431 | All SZGR 2.0 genes in this pathway |
| BILANGES SERUM AND RAPAMYCIN SENSITIVE GENES | 68 | 35 | All SZGR 2.0 genes in this pathway |
| BILANGES SERUM RESPONSE TRANSLATION | 37 | 20 | All SZGR 2.0 genes in this pathway |
| HOLLEMAN ASPARAGINASE RESISTANCE B ALL UP | 26 | 15 | All SZGR 2.0 genes in this pathway |