Gene Page: KLHDC8B
Summary ?
| GeneID | 200942 |
| Symbol | KLHDC8B |
| Synonyms | CHL |
| Description | kelch domain containing 8B |
| Reference | MIM:613169|HGNC:HGNC:28557|Ensembl:ENSG00000185909|HPRD:14598|Vega:OTTHUMG00000156814 |
| Gene type | protein-coding |
| Map location | 3p21.31 |
| Pascal p-value | 0.025 |
| Fetal beta | -0.653 |
| DMG | 2 (# studies) |
| eGene | Myers' cis & trans |
Gene in Data Sources
| Gene set name | Method of gene set | Description | Info |
|---|---|---|---|
| CV:PGCnp | Genome-wide Association Study | GWAS | |
| DMG:Jaffe_2016 | Genome-wide DNA methylation analysis | This dataset includes 2,104 probes/CpGs associated with SZ patients (n=108) compared to 136 controls at Bonferroni-adjusted P < 0.05. | 2 |
| DMG:Wockner_2014 | Genome-wide DNA methylation analysis | This dataset includes 4641 differentially methylated probes corresponding to 2929 unique genes between schizophrenia patients (n=24) and controls (n=24). | 2 |
Section I. Genetics and epigenetics annotation
 Differentially methylated gene
| Probe | Chromosome | Position | Nearest gene | P (dis) | Beta (dis) | FDR (dis) | Study |
|---|---|---|---|---|---|---|---|
| cg10255761 | 3 | 49210029 | KLHDC8B | 1.074E-4 | 0.267 | 0.028 | DMG:Wockner_2014 |
| cg10872212 | 3 | 49209160 | KLHDC8B | 2.81E-8 | -0.019 | 8.77E-6 | DMG:Jaffe_2016 |
eQTL annotation
| SNP ID | Chromosome | Position | eGene | Gene Entrez ID | pvalue | qvalue | TSS distance | eQTL type |
|---|---|---|---|---|---|---|---|---|
| rs7370564 | 0 | KLHDC8B | 200942 | 0.15 | trans | |||
| rs10994209 | chr10 | 61877705 | KLHDC8B | 200942 | 0.09 | trans | ||
| rs7972594 | chr12 | 11724913 | KLHDC8B | 200942 | 0.17 | trans | ||
| rs10491979 | chr12 | 11727969 | KLHDC8B | 200942 | 0.17 | trans |
Section II. Transcriptome annotation
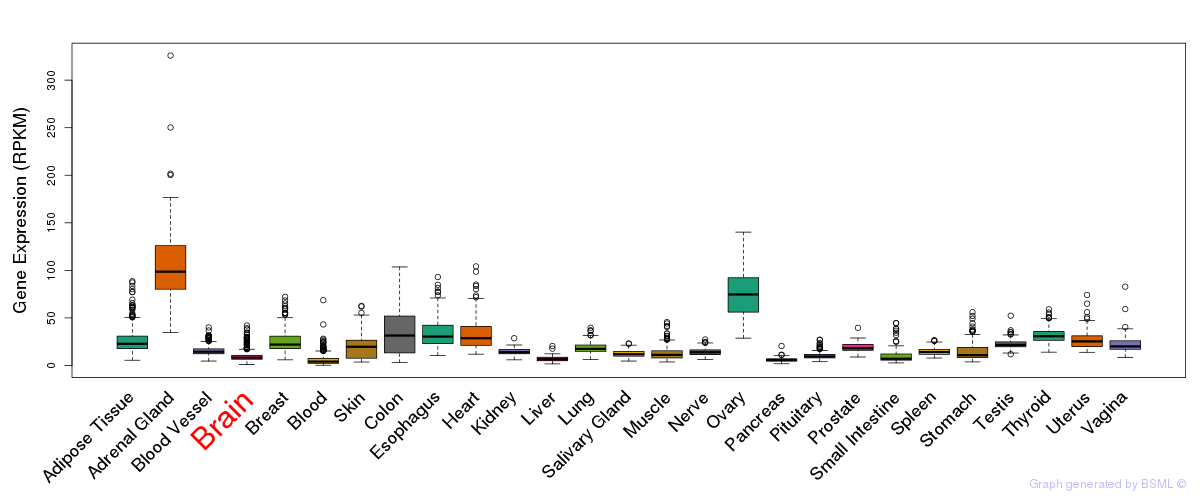
General gene expression (GTEx)
Gene expression during devlopment (BrainCloud)
Footnote:
A total of 269 time points ploted, with n=38 fetal samples (x=1:38). Each triangle represents one time point.
Gene expression of temporal and spatial changes (BrainSpan)
Footnote:
SC: sub-cortical regions; SM: sensory-motor regions; FC: frontal cortex; and TP: temporal-parietal cortex
ST1: fetal (13 - 26 postconception weeks), ST2: early infancy to late childhood (4 months to 11 years), and ST3: adolescence to adulthood (13 - 23 years)
The bar shown representes the lower 25% and upper 25% of the expression distribution.
No co-expressed genes in brain regions
Section V. Pathway annotation
| Pathway name | Pathway size | # SZGR 2.0 genes in pathway | Info |
|---|---|---|---|
| FULCHER INFLAMMATORY RESPONSE LECTIN VS LPS DN | 463 | 290 | All SZGR 2.0 genes in this pathway |
| KINSEY TARGETS OF EWSR1 FLII FUSION DN | 329 | 219 | All SZGR 2.0 genes in this pathway |
| DODD NASOPHARYNGEAL CARCINOMA UP | 1821 | 933 | All SZGR 2.0 genes in this pathway |
| RODRIGUES THYROID CARCINOMA POORLY DIFFERENTIATED DN | 805 | 505 | All SZGR 2.0 genes in this pathway |
| GARCIA TARGETS OF FLI1 AND DAX1 UP | 57 | 34 | All SZGR 2.0 genes in this pathway |
| KOYAMA SEMA3B TARGETS DN | 411 | 249 | All SZGR 2.0 genes in this pathway |
| CHYLA CBFA2T3 TARGETS DN | 242 | 146 | All SZGR 2.0 genes in this pathway |