Gene Page: EPO
Summary ?
| GeneID | 2056 |
| Symbol | EPO |
| Synonyms | EP|MVCD2 |
| Description | erythropoietin |
| Reference | MIM:133170|HGNC:HGNC:3415|Ensembl:ENSG00000130427|HPRD:00586|Vega:OTTHUMG00000152121 |
| Gene type | protein-coding |
| Map location | 7q22 |
| Pascal p-value | 6.193E-4 |
| Fetal beta | 0.268 |
| DMG | 1 (# studies) |
| eGene | Cerebellar Hemisphere |
Gene in Data Sources
| Gene set name | Method of gene set | Description | Info |
|---|---|---|---|
| CV:PGCnp | Genome-wide Association Study | GWAS | |
| DMG:Wockner_2014 | Genome-wide DNA methylation analysis | This dataset includes 4641 differentially methylated probes corresponding to 2929 unique genes between schizophrenia patients (n=24) and controls (n=24). | 1 |
| PMID:cooccur | High-throughput literature-search | Systematic search in PubMed for genes co-occurring with SCZ keywords. A total of 3027 genes were included. | |
| Literature | High-throughput literature-search | Co-occurance with Schizophrenia keywords: schizophrenia,schizophrenic,schizophrenias | Click to show details |
Section I. Genetics and epigenetics annotation
 Differentially methylated gene
| Probe | Chromosome | Position | Nearest gene | P (dis) | Beta (dis) | FDR (dis) | Study |
|---|---|---|---|---|---|---|---|
| cg26071806 | 7 | 100318239 | EPO | 1.12E-5 | -0.301 | 0.013 | DMG:Wockner_2014 |
Section II. Transcriptome annotation
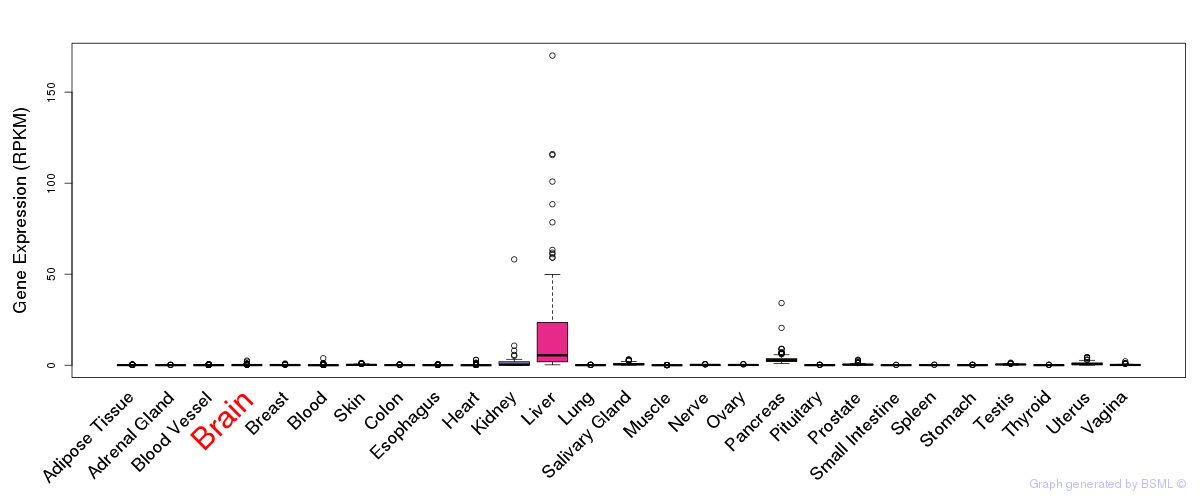
General gene expression (GTEx)
Gene expression during devlopment (BrainCloud)
Footnote:
A total of 269 time points ploted, with n=38 fetal samples (x=1:38). Each triangle represents one time point.
Gene expression of temporal and spatial changes (BrainSpan)
Footnote:
SC: sub-cortical regions; SM: sensory-motor regions; FC: frontal cortex; and TP: temporal-parietal cortex
ST1: fetal (13 - 26 postconception weeks), ST2: early infancy to late childhood (4 months to 11 years), and ST3: adolescence to adulthood (13 - 23 years)
The bar shown representes the lower 25% and upper 25% of the expression distribution.
Top co-expressed genes in brain regions
| Top 10 positively co-expressed genes | ||
| Gene | Pearson's Correlation | Spearman's Correlation |
| EIF2B5 | 0.94 | 0.94 |
| EIF2B1 | 0.93 | 0.93 |
| MBTPS1 | 0.92 | 0.92 |
| RNF10 | 0.92 | 0.91 |
| STRADA | 0.92 | 0.93 |
| WDR59 | 0.91 | 0.92 |
| DHX16 | 0.91 | 0.92 |
| EXOC7 | 0.91 | 0.92 |
| EIF4ENIF1 | 0.91 | 0.91 |
| ZNF174 | 0.91 | 0.90 |
| Top 10 negatively co-expressed genes | ||
| Gene | Pearson's Correlation | Spearman's Correlation |
| AF347015.31 | -0.84 | -0.83 |
| MT-CO2 | -0.83 | -0.82 |
| AF347015.8 | -0.81 | -0.82 |
| AF347015.21 | -0.81 | -0.86 |
| AF347015.27 | -0.81 | -0.81 |
| MT-CYB | -0.80 | -0.79 |
| AF347015.33 | -0.79 | -0.78 |
| AF347015.2 | -0.78 | -0.79 |
| AF347015.15 | -0.77 | -0.78 |
| HIGD1B | -0.77 | -0.79 |