Gene Page: FABP6
Summary ?
| GeneID | 2172 |
| Symbol | FABP6 |
| Synonyms | I-15P|I-BABP|I-BALB|I-BAP|ILBP|ILBP3|ILLBP |
| Description | fatty acid binding protein 6 |
| Reference | MIM:600422|HGNC:HGNC:3561|Ensembl:ENSG00000170231|HPRD:02689|Vega:OTTHUMG00000130329 |
| Gene type | protein-coding |
| Map location | 5q33.3-q34 |
| Pascal p-value | 0.221 |
| Sherlock p-value | 0.026 |
| Fetal beta | -0.903 |
| eGene | Myers' cis & trans |
Gene in Data Sources
| Gene set name | Method of gene set | Description | Info |
|---|---|---|---|
| CV:PGCnp | Genome-wide Association Study | GWAS | |
| GSMA_I | Genome scan meta-analysis | Psr: 0.0032 | |
| GSMA_IIE | Genome scan meta-analysis (European-ancestry samples) | Psr: 0.01718 | |
| GSMA_IIA | Genome scan meta-analysis (All samples) | Psr: 0.00459 |
Section I. Genetics and epigenetics annotation
 eQTL annotation
| SNP ID | Chromosome | Position | eGene | Gene Entrez ID | pvalue | qvalue | TSS distance | eQTL type |
|---|---|---|---|---|---|---|---|---|
| rs962101 | chr5 | 160353230 | FABP6 | 2172 | 0.04 | cis |
Section II. Transcriptome annotation
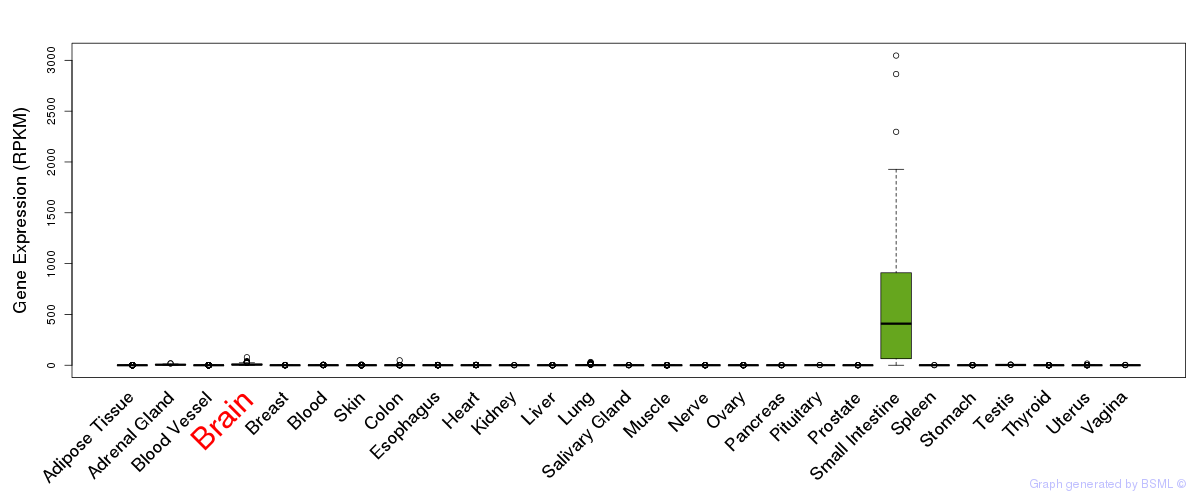
General gene expression (GTEx)
Gene expression during devlopment (BrainCloud)
Footnote:
A total of 269 time points ploted, with n=38 fetal samples (x=1:38). Each triangle represents one time point.
Gene expression of temporal and spatial changes (BrainSpan)
Footnote:
SC: sub-cortical regions; SM: sensory-motor regions; FC: frontal cortex; and TP: temporal-parietal cortex
ST1: fetal (13 - 26 postconception weeks), ST2: early infancy to late childhood (4 months to 11 years), and ST3: adolescence to adulthood (13 - 23 years)
The bar shown representes the lower 25% and upper 25% of the expression distribution.
Top co-expressed genes in brain regions
| Top 10 positively co-expressed genes | ||
| Gene | Pearson's Correlation | Spearman's Correlation |
| SMC4 | 0.82 | 0.59 |
| SGOL2 | 0.82 | 0.63 |
| C14orf106 | 0.82 | 0.65 |
| RTKN2 | 0.82 | 0.56 |
| KIF11 | 0.82 | 0.63 |
| SMC2 | 0.82 | 0.70 |
| ECT2 | 0.82 | 0.62 |
| ATAD2 | 0.82 | 0.62 |
| BRIP1 | 0.82 | 0.60 |
| MCM8 | 0.81 | 0.69 |
| Top 10 negatively co-expressed genes | ||
| Gene | Pearson's Correlation | Spearman's Correlation |
| CXCL14 | -0.41 | -0.60 |
| IFI27 | -0.41 | -0.59 |
| PTH1R | -0.41 | -0.54 |
| CST3 | -0.41 | -0.59 |
| MT-CO2 | -0.40 | -0.55 |
| AF347015.31 | -0.40 | -0.54 |
| AC011427.1 | -0.39 | -0.51 |
| AIFM3 | -0.38 | -0.50 |
| MT-CYB | -0.38 | -0.53 |
| FXYD1 | -0.38 | -0.55 |
Section III. Gene Ontology annotation
| Molecular function | GO term | Evidence | Neuro keywords | PubMed ID |
|---|---|---|---|---|
| GO:0005215 | transporter activity | IEA | - | |
| GO:0008289 | lipid binding | IEA | - | |
| GO:0008289 | lipid binding | TAS | 7588781 | |
| Biological process | GO term | Evidence | Neuro keywords | PubMed ID |
| GO:0008285 | negative regulation of cell proliferation | TAS | 9250612 | |
| GO:0006810 | transport | IEA | - | |
| GO:0006629 | lipid metabolic process | NAS | 9250612 | |
| Cellular component | GO term | Evidence | Neuro keywords | PubMed ID |
| GO:0005737 | cytoplasm | TAS | 7588781 |
Section V. Pathway annotation
| Pathway name | Pathway size | # SZGR 2.0 genes in pathway | Info |
|---|---|---|---|
| KEGG PPAR SIGNALING PATHWAY | 69 | 47 | All SZGR 2.0 genes in this pathway |
| REACTOME BILE ACID AND BILE SALT METABOLISM | 27 | 11 | All SZGR 2.0 genes in this pathway |
| REACTOME METABOLISM OF LIPIDS AND LIPOPROTEINS | 478 | 302 | All SZGR 2.0 genes in this pathway |
| SABATES COLORECTAL ADENOMA UP | 141 | 75 | All SZGR 2.0 genes in this pathway |
| LIU CDX2 TARGETS UP | 36 | 22 | All SZGR 2.0 genes in this pathway |
| NAKAMURA LUNG CANCER DIFFERENTIATION MARKERS | 14 | 5 | All SZGR 2.0 genes in this pathway |
| KOBAYASHI RESPONSE TO ROMIDEPSIN | 19 | 14 | All SZGR 2.0 genes in this pathway |
| RICKMAN HEAD AND NECK CANCER A | 100 | 63 | All SZGR 2.0 genes in this pathway |
| YOKOE CANCER TESTIS ANTIGENS | 38 | 22 | All SZGR 2.0 genes in this pathway |
| ACEVEDO METHYLATED IN LIVER CANCER DN | 940 | 425 | All SZGR 2.0 genes in this pathway |
| YAUCH HEDGEHOG SIGNALING PARACRINE DN | 264 | 159 | All SZGR 2.0 genes in this pathway |
| YOSHIMURA MAPK8 TARGETS UP | 1305 | 895 | All SZGR 2.0 genes in this pathway |
| FEVR CTNNB1 TARGETS UP | 682 | 433 | All SZGR 2.0 genes in this pathway |
| KRIEG HYPOXIA VIA KDM3A | 53 | 34 | All SZGR 2.0 genes in this pathway |