Gene Page: ATG14
Summary ?
| GeneID | 22863 |
| Symbol | ATG14 |
| Synonyms | ATG14L|BARKOR|KIAA0831 |
| Description | autophagy related 14 |
| Reference | MIM:613515|HGNC:HGNC:19962|Ensembl:ENSG00000126775|HPRD:13820|Vega:OTTHUMG00000172129 |
| Gene type | protein-coding |
| Map location | 14q22.3 |
| Pascal p-value | 0.219 |
| Sherlock p-value | 0.01 |
| Fetal beta | 0.618 |
Gene in Data Sources
| Gene set name | Method of gene set | Description | Info |
|---|---|---|---|
| CV:PGCnp | Genome-wide Association Study | GWAS |
Section I. Genetics and epigenetics annotation
Section II. Transcriptome annotation
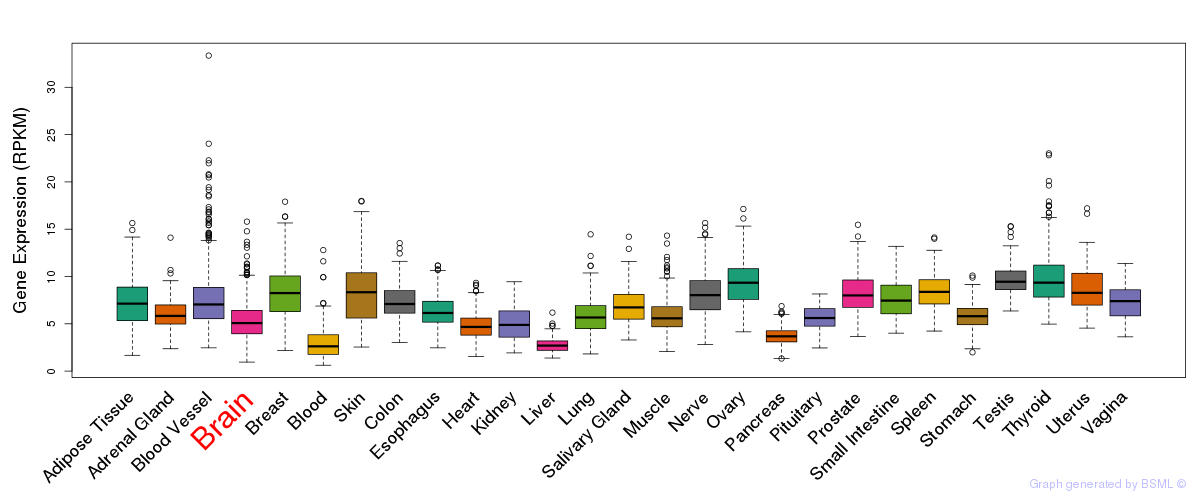
General gene expression (GTEx)
Gene expression during devlopment (BrainCloud)
Footnote:
A total of 269 time points ploted, with n=38 fetal samples (x=1:38). Each triangle represents one time point.
Gene expression of temporal and spatial changes (BrainSpan)
Footnote:
SC: sub-cortical regions; SM: sensory-motor regions; FC: frontal cortex; and TP: temporal-parietal cortex
ST1: fetal (13 - 26 postconception weeks), ST2: early infancy to late childhood (4 months to 11 years), and ST3: adolescence to adulthood (13 - 23 years)
The bar shown representes the lower 25% and upper 25% of the expression distribution.
Top co-expressed genes in brain regions
| Top 10 positively co-expressed genes | ||
| Gene | Pearson's Correlation | Spearman's Correlation |
| KIAA1045 | 0.95 | 0.94 |
| PITPNM2 | 0.94 | 0.93 |
| IQSEC2 | 0.91 | 0.92 |
| KALRN | 0.91 | 0.92 |
| RIMBP2 | 0.90 | 0.89 |
| PIP5K1C | 0.89 | 0.92 |
| RAB11FIP4 | 0.89 | 0.88 |
| PITPNM3 | 0.88 | 0.84 |
| UNC13A | 0.88 | 0.89 |
| LRRK1 | 0.88 | 0.78 |
| Top 10 negatively co-expressed genes | ||
| Gene | Pearson's Correlation | Spearman's Correlation |
| PECI | -0.46 | -0.51 |
| RAB13 | -0.45 | -0.58 |
| DBI | -0.43 | -0.54 |
| BCL7C | -0.41 | -0.46 |
| RHOC | -0.41 | -0.51 |
| MYL12A | -0.40 | -0.57 |
| RAB34 | -0.40 | -0.51 |
| ACAA2 | -0.39 | -0.44 |
| AL139819.3 | -0.39 | -0.45 |
| GNG11 | -0.39 | -0.52 |
Section V. Pathway annotation
| Pathway name | Pathway size | # SZGR 2.0 genes in pathway | Info |
|---|---|---|---|
| NAKAMURA TUMOR ZONE PERIPHERAL VS CENTRAL DN | 634 | 384 | All SZGR 2.0 genes in this pathway |
| ONKEN UVEAL MELANOMA UP | 783 | 507 | All SZGR 2.0 genes in this pathway |
| UDAYAKUMAR MED1 TARGETS DN | 240 | 171 | All SZGR 2.0 genes in this pathway |
| ELVIDGE HYPOXIA UP | 171 | 112 | All SZGR 2.0 genes in this pathway |
| ELVIDGE HYPOXIA BY DMOG UP | 130 | 85 | All SZGR 2.0 genes in this pathway |
| BUYTAERT PHOTODYNAMIC THERAPY STRESS UP | 811 | 508 | All SZGR 2.0 genes in this pathway |
| ZHAN MULTIPLE MYELOMA CD1 AND CD2 UP | 89 | 51 | All SZGR 2.0 genes in this pathway |
| ACEVEDO LIVER TUMOR VS NORMAL ADJACENT TISSUE DN | 274 | 165 | All SZGR 2.0 genes in this pathway |
| DELACROIX RAR BOUND ES | 462 | 273 | All SZGR 2.0 genes in this pathway |
| RAO BOUND BY SALL4 | 227 | 149 | All SZGR 2.0 genes in this pathway |