Gene Page: R3HDM2
Summary ?
| GeneID | 22864 |
| Symbol | R3HDM2 |
| Synonyms | CAG6|PR01365 |
| Description | R3H domain containing 2 |
| Reference | HGNC:HGNC:29167|Ensembl:ENSG00000179912|HPRD:13827|Vega:OTTHUMG00000171568 |
| Gene type | protein-coding |
| Map location | 12q13.3 |
| Pascal p-value | 0.005 |
| Sherlock p-value | 0.045 |
| Fetal beta | 0.142 |
| DMG | 1 (# studies) |
| eGene | Myers' cis & trans |
| Support | CompositeSet Darnell FMRP targets |
Gene in Data Sources
| Gene set name | Method of gene set | Description | Info |
|---|---|---|---|
| CV:PGCnp | Genome-wide Association Study | GWAS | |
| DMG:Jaffe_2016 | Genome-wide DNA methylation analysis | This dataset includes 2,104 probes/CpGs associated with SZ patients (n=108) compared to 136 controls at Bonferroni-adjusted P < 0.05. | 1 |
Section I. Genetics and epigenetics annotation
 Differentially methylated gene
| Probe | Chromosome | Position | Nearest gene | P (dis) | Beta (dis) | FDR (dis) | Study |
|---|---|---|---|---|---|---|---|
| cg02339937 | 12 | 57824242 | R3HDM2 | 6.89E-8 | -0.026 | 1.68E-5 | DMG:Jaffe_2016 |
eQTL annotation
| SNP ID | Chromosome | Position | eGene | Gene Entrez ID | pvalue | qvalue | TSS distance | eQTL type |
|---|---|---|---|---|---|---|---|---|
| rs10994209 | chr10 | 61877705 | R3HDM2 | 22864 | 0.09 | trans |
Section II. Transcriptome annotation
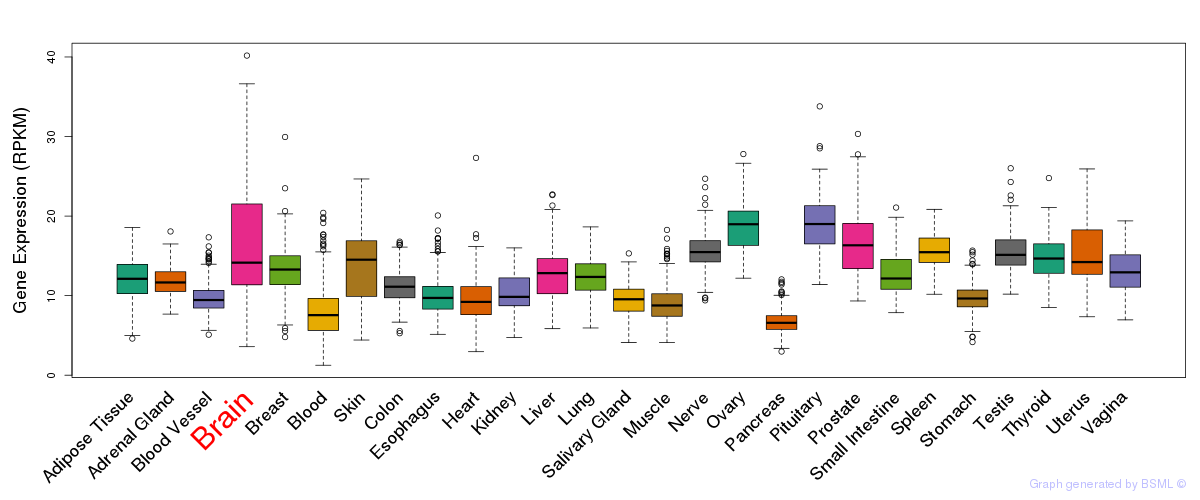
General gene expression (GTEx)
Gene expression during devlopment (BrainCloud)
Footnote:
A total of 269 time points ploted, with n=38 fetal samples (x=1:38). Each triangle represents one time point.
Gene expression of temporal and spatial changes (BrainSpan)
Footnote:
SC: sub-cortical regions; SM: sensory-motor regions; FC: frontal cortex; and TP: temporal-parietal cortex
ST1: fetal (13 - 26 postconception weeks), ST2: early infancy to late childhood (4 months to 11 years), and ST3: adolescence to adulthood (13 - 23 years)
The bar shown representes the lower 25% and upper 25% of the expression distribution.
Top co-expressed genes in brain regions
| Top 10 positively co-expressed genes | ||
| Gene | Pearson's Correlation | Spearman's Correlation |
| DGKZ | 0.89 | 0.87 |
| C2orf55 | 0.89 | 0.94 |
| ARHGEF4 | 0.88 | 0.85 |
| ANKRD43 | 0.88 | 0.95 |
| FBXL16 | 0.88 | 0.87 |
| ICAM5 | 0.88 | 0.94 |
| SAPS1 | 0.87 | 0.79 |
| ADAMTS8 | 0.87 | 0.89 |
| SYNPO | 0.87 | 0.93 |
| CACNG3 | 0.87 | 0.78 |
| Top 10 negatively co-expressed genes | ||
| Gene | Pearson's Correlation | Spearman's Correlation |
| KIAA1949 | -0.58 | -0.55 |
| TUBB2B | -0.58 | -0.60 |
| TRAF4 | -0.55 | -0.65 |
| ZNF193 | -0.55 | -0.54 |
| DYNLT1 | -0.55 | -0.68 |
| IDH1 | -0.54 | -0.54 |
| TIGD1 | -0.54 | -0.55 |
| ZNF311 | -0.54 | -0.51 |
| CARHSP1 | -0.54 | -0.62 |
| SH3BP2 | -0.54 | -0.60 |
Section V. Pathway annotation
| Pathway name | Pathway size | # SZGR 2.0 genes in pathway | Info |
|---|---|---|---|
| GARY CD5 TARGETS UP | 473 | 314 | All SZGR 2.0 genes in this pathway |
| DACOSTA UV RESPONSE VIA ERCC3 DN | 855 | 609 | All SZGR 2.0 genes in this pathway |
| DACOSTA UV RESPONSE VIA ERCC3 COMMON DN | 483 | 336 | All SZGR 2.0 genes in this pathway |
| FLECHNER BIOPSY KIDNEY TRANSPLANT REJECTED VS OK DN | 546 | 351 | All SZGR 2.0 genes in this pathway |
| FLECHNER BIOPSY KIDNEY TRANSPLANT OK VS DONOR UP | 555 | 346 | All SZGR 2.0 genes in this pathway |
| KIM BIPOLAR DISORDER OLIGODENDROCYTE DENSITY CORR UP | 682 | 440 | All SZGR 2.0 genes in this pathway |
| WANG RESPONSE TO GSK3 INHIBITOR SB216763 UP | 397 | 206 | All SZGR 2.0 genes in this pathway |