Gene Page: MYH15
Summary ?
| GeneID | 22989 |
| Symbol | MYH15 |
| Synonyms | - |
| Description | myosin, heavy chain 15 |
| Reference | MIM:609929|HGNC:HGNC:31073|Ensembl:ENSG00000144821|Vega:OTTHUMG00000159226 |
| Gene type | protein-coding |
| Map location | 3q13.13 |
| Pascal p-value | 0.228 |
| Fetal beta | -0.539 |
| DMG | 1 (# studies) |
| eGene | Nucleus accumbens basal ganglia |
Gene in Data Sources
| Gene set name | Method of gene set | Description | Info |
|---|---|---|---|
| CV:PGCnp | Genome-wide Association Study | GWAS | |
| DMG:Wockner_2014 | Genome-wide DNA methylation analysis | This dataset includes 4641 differentially methylated probes corresponding to 2929 unique genes between schizophrenia patients (n=24) and controls (n=24). | 1 |
| GSMA_IIE | Genome scan meta-analysis (European-ancestry samples) | Psr: 0.04359 | |
| GSMA_IIA | Genome scan meta-analysis (All samples) | Psr: 0.04047 |
Section I. Genetics and epigenetics annotation
 Differentially methylated gene
| Probe | Chromosome | Position | Nearest gene | P (dis) | Beta (dis) | FDR (dis) | Study |
|---|---|---|---|---|---|---|---|
| cg01135165 | 3 | 108191083 | MYH15 | 2.636E-4 | 0.421 | 0.038 | DMG:Wockner_2014 |
Section II. Transcriptome annotation
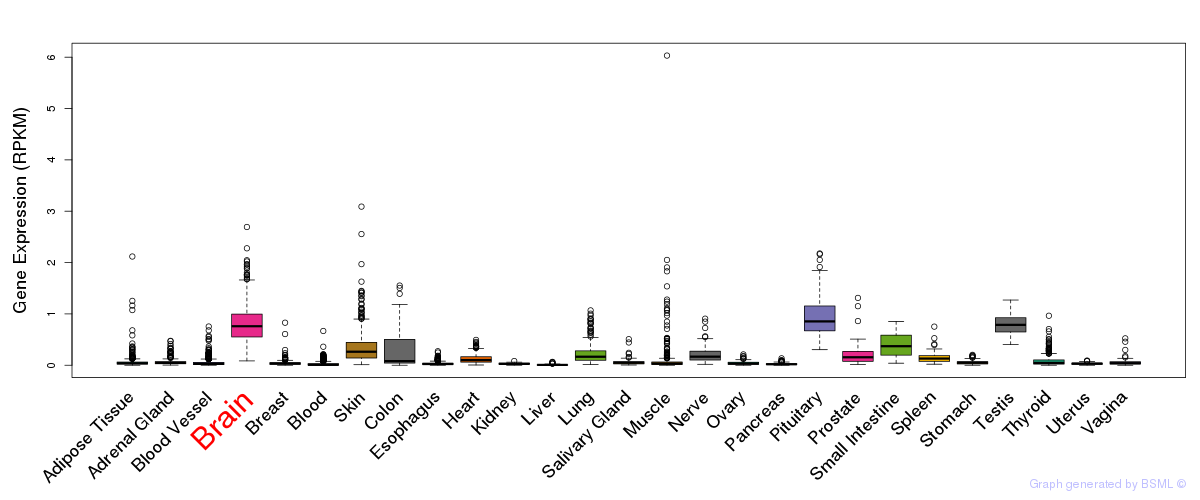
General gene expression (GTEx)
Gene expression during devlopment (BrainCloud)
Footnote:
A total of 269 time points ploted, with n=38 fetal samples (x=1:38). Each triangle represents one time point.
Gene expression of temporal and spatial changes (BrainSpan)
Footnote:
SC: sub-cortical regions; SM: sensory-motor regions; FC: frontal cortex; and TP: temporal-parietal cortex
ST1: fetal (13 - 26 postconception weeks), ST2: early infancy to late childhood (4 months to 11 years), and ST3: adolescence to adulthood (13 - 23 years)
The bar shown representes the lower 25% and upper 25% of the expression distribution.
Top co-expressed genes in brain regions
| Top 10 positively co-expressed genes | ||
| Gene | Pearson's Correlation | Spearman's Correlation |
| SSRP1 | 0.95 | 0.94 |
| RPIA | 0.94 | 0.93 |
| EWSR1 | 0.94 | 0.93 |
| HNRNPH1 | 0.93 | 0.94 |
| TRA2A | 0.93 | 0.92 |
| HNRNPUL1 | 0.93 | 0.91 |
| MARK3 | 0.93 | 0.93 |
| TRA2B | 0.93 | 0.93 |
| RAF1 | 0.93 | 0.93 |
| PPP4R1 | 0.93 | 0.90 |
| Top 10 negatively co-expressed genes | ||
| Gene | Pearson's Correlation | Spearman's Correlation |
| HLA-F | -0.79 | -0.79 |
| AF347015.31 | -0.79 | -0.91 |
| AF347015.27 | -0.78 | -0.89 |
| MT-CO2 | -0.77 | -0.90 |
| AIFM3 | -0.77 | -0.77 |
| AF347015.33 | -0.76 | -0.88 |
| TSC22D4 | -0.76 | -0.81 |
| ALDOC | -0.75 | -0.73 |
| MT-CYB | -0.75 | -0.89 |
| C5orf53 | -0.75 | -0.73 |
Section III. Gene Ontology annotation
| Molecular function | GO term | Evidence | Neuro keywords | PubMed ID |
|---|---|---|---|---|
| GO:0000166 | nucleotide binding | IEA | - | |
| GO:0003779 | actin binding | IEA | - | |
| GO:0003774 | motor activity | IEA | - | |
| GO:0005516 | calmodulin binding | IEA | - | |
| GO:0005524 | ATP binding | IEA | - | |
| Biological process | GO term | Evidence | Neuro keywords | PubMed ID |
| GO:0006941 | striated muscle contraction | IEA | - | |
| Cellular component | GO term | Evidence | Neuro keywords | PubMed ID |
| GO:0005863 | striated muscle thick filament | IEA | - | |
| GO:0005737 | cytoplasm | IEA | - | |
| GO:0016459 | myosin complex | IEA | - |
Section V. Pathway annotation
| Pathway name | Pathway size | # SZGR 2.0 genes in pathway | Info |
|---|---|---|---|
| KEGG TIGHT JUNCTION | 134 | 86 | All SZGR 2.0 genes in this pathway |
| KEGG VIRAL MYOCARDITIS | 73 | 58 | All SZGR 2.0 genes in this pathway |
| PUJANA ATM PCC NETWORK | 1442 | 892 | All SZGR 2.0 genes in this pathway |
| ZWANG EGF INTERVAL UP | 105 | 46 | All SZGR 2.0 genes in this pathway |