Gene Page: CEP152
Summary ?
| GeneID | 22995 |
| Symbol | CEP152 |
| Synonyms | MCPH4|MCPH9|SCKL5 |
| Description | centrosomal protein 152kDa |
| Reference | MIM:613529|HGNC:HGNC:29298|Ensembl:ENSG00000103995|HPRD:16778|Vega:OTTHUMG00000172219 |
| Gene type | protein-coding |
| Map location | 15q21.1 |
| Pascal p-value | 0.534 |
| Fetal beta | 1.545 |
| DMG | 1 (# studies) |
| Support | Ascano FMRP targets |
Gene in Data Sources
| Gene set name | Method of gene set | Description | Info |
|---|---|---|---|
| CV:GWASdb | Genome-wide Association Studies | GWASdb records for schizophrenia | |
| CV:PGCnp | Genome-wide Association Study | GWAS | |
| DMG:Jaffe_2016 | Genome-wide DNA methylation analysis | This dataset includes 2,104 probes/CpGs associated with SZ patients (n=108) compared to 136 controls at Bonferroni-adjusted P < 0.05. | 1 |
Section I. Genetics and epigenetics annotation
 Differentially methylated gene
| Probe | Chromosome | Position | Nearest gene | P (dis) | Beta (dis) | FDR (dis) | Study |
|---|---|---|---|---|---|---|---|
| cg21041764 | 15 | 49103369 | CEP152 | 1.04E-8 | -0.015 | 4.49E-6 | DMG:Jaffe_2016 |
Section II. Transcriptome annotation
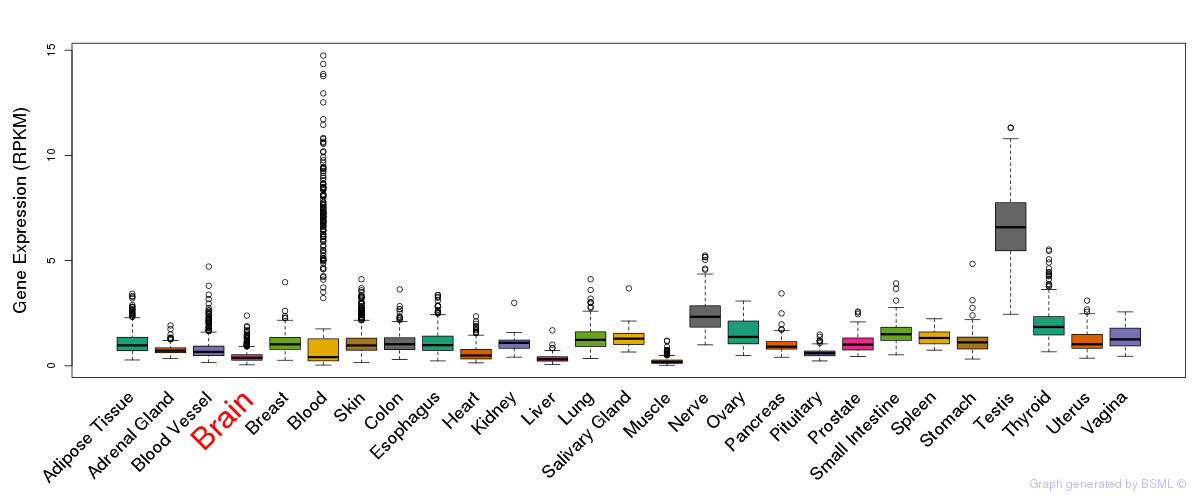
General gene expression (GTEx)
Gene expression during devlopment (BrainCloud)
Footnote:
A total of 269 time points ploted, with n=38 fetal samples (x=1:38). Each triangle represents one time point.
Gene expression of temporal and spatial changes (BrainSpan)
Footnote:
SC: sub-cortical regions; SM: sensory-motor regions; FC: frontal cortex; and TP: temporal-parietal cortex
ST1: fetal (13 - 26 postconception weeks), ST2: early infancy to late childhood (4 months to 11 years), and ST3: adolescence to adulthood (13 - 23 years)
The bar shown representes the lower 25% and upper 25% of the expression distribution.
Top co-expressed genes in brain regions
| Top 10 positively co-expressed genes | ||
| Gene | Pearson's Correlation | Spearman's Correlation |
| LBR | 0.93 | 0.88 |
| SMARCD1 | 0.92 | 0.93 |
| PAXIP1 | 0.92 | 0.92 |
| CASP2 | 0.91 | 0.93 |
| ZCCHC11 | 0.91 | 0.92 |
| ZIK1 | 0.91 | 0.91 |
| SCML2 | 0.91 | 0.88 |
| BUD13 | 0.90 | 0.89 |
| CDK5RAP2 | 0.90 | 0.87 |
| LMNB1 | 0.90 | 0.91 |
| Top 10 negatively co-expressed genes | ||
| Gene | Pearson's Correlation | Spearman's Correlation |
| AIFM3 | -0.67 | -0.79 |
| C5orf53 | -0.67 | -0.75 |
| ALDOC | -0.67 | -0.73 |
| FBXO2 | -0.67 | -0.67 |
| HLA-F | -0.67 | -0.76 |
| PTH1R | -0.67 | -0.74 |
| LHPP | -0.66 | -0.62 |
| LDHD | -0.66 | -0.68 |
| S100B | -0.65 | -0.83 |
| CLU | -0.64 | -0.70 |
Section V. Pathway annotation
| Pathway name | Pathway size | # SZGR 2.0 genes in pathway | Info |
|---|---|---|---|
| GARY CD5 TARGETS DN | 431 | 263 | All SZGR 2.0 genes in this pathway |
| KINSEY TARGETS OF EWSR1 FLII FUSION UP | 1278 | 748 | All SZGR 2.0 genes in this pathway |
| DODD NASOPHARYNGEAL CARCINOMA DN | 1375 | 806 | All SZGR 2.0 genes in this pathway |
| GRAESSMANN APOPTOSIS BY DOXORUBICIN DN | 1781 | 1082 | All SZGR 2.0 genes in this pathway |
| GRAESSMANN RESPONSE TO MC AND DOXORUBICIN DN | 770 | 415 | All SZGR 2.0 genes in this pathway |
| KIM MYC AMPLIFICATION TARGETS UP | 201 | 127 | All SZGR 2.0 genes in this pathway |
| ONDER CDH1 TARGETS 1 UP | 140 | 85 | All SZGR 2.0 genes in this pathway |
| MOREAUX B LYMPHOCYTE MATURATION BY TACI DN | 73 | 45 | All SZGR 2.0 genes in this pathway |
| MOREAUX MULTIPLE MYELOMA BY TACI DN | 172 | 107 | All SZGR 2.0 genes in this pathway |
| SU PANCREAS | 54 | 30 | All SZGR 2.0 genes in this pathway |
| TOYOTA TARGETS OF MIR34B AND MIR34C | 463 | 262 | All SZGR 2.0 genes in this pathway |
| PYEON CANCER HEAD AND NECK VS CERVICAL UP | 193 | 95 | All SZGR 2.0 genes in this pathway |
| GOBERT OLIGODENDROCYTE DIFFERENTIATION UP | 570 | 339 | All SZGR 2.0 genes in this pathway |