Gene Page: IGSF9B
Summary ?
| GeneID | 22997 |
| Symbol | IGSF9B |
| Synonyms | - |
| Description | immunoglobulin superfamily member 9B |
| Reference | MIM:613773|HGNC:HGNC:32326|Ensembl:ENSG00000080854|Vega:OTTHUMG00000167124 |
| Gene type | protein-coding |
| Map location | 11q25 |
| Pascal p-value | 1E-12 |
| Sherlock p-value | 0.719 |
| Fetal beta | -0.496 |
| DMG | 2 (# studies) |
| eGene | Myers' cis & trans |
| Support | CompositeSet Darnell FMRP targets |
Gene in Data Sources
| Gene set name | Method of gene set | Description | Info |
|---|---|---|---|
| CV:GWAScat | Genome-wide Association Studies | This data set includes 560 SNPs associated with schizophrenia. A total of 486 genes were mapped to these SNPs within 50kb. | |
| CV:GWASdb | Genome-wide Association Studies | GWASdb records for schizophrenia | |
| CV:PGC128 | Genome-wide Association Study | A multi-stage schizophrenia GWAS of up to 36,989 cases and 113,075 controls. Reported by the Schizophrenia Working Group of PGC. 128 independent associations spanning 108 loci | |
| CV:PGCnp | Genome-wide Association Study | GWAS | |
| DMG:Jaffe_2016 | Genome-wide DNA methylation analysis | This dataset includes 2,104 probes/CpGs associated with SZ patients (n=108) compared to 136 controls at Bonferroni-adjusted P < 0.05. | 3 |
| DMG:Wockner_2014 | Genome-wide DNA methylation analysis | This dataset includes 4641 differentially methylated probes corresponding to 2929 unique genes between schizophrenia patients (n=24) and controls (n=24). | 3 |
| PMID:cooccur | High-throughput literature-search | Systematic search in PubMed for genes co-occurring with SCZ keywords. A total of 3027 genes were included. | |
| Literature | High-throughput literature-search | Co-occurance with Schizophrenia keywords: schizophrenia,schizophrenias | Click to show details |
Section I. Genetics and epigenetics annotation
 CV:PGC128
| SNP ID | Chromosome | Position | Allele | P | Function | Gene | Up/Down Distance |
|---|---|---|---|---|---|---|---|
| rs75059851 | chr11 | 133822569 | AG | 1.232E-11 | intronic | IGSF9B |
Differentially methylated gene
| Probe | Chromosome | Position | Nearest gene | P (dis) | Beta (dis) | FDR (dis) | Study |
|---|---|---|---|---|---|---|---|
| cg03392386 | 11 | 133800800 | IGSF9B | 7.63E-5 | 0.511 | 0.025 | DMG:Wockner_2014 |
| cg18057887 | 11 | 133800913 | IGSF9B | 2.193E-4 | 0.396 | 0.036 | DMG:Wockner_2014 |
| cg18162528 | 11 | 133826660 | IGSF9B | 1.31E-10 | -0.021 | 4.86E-7 | DMG:Jaffe_2016 |
eQTL annotation
| SNP ID | Chromosome | Position | eGene | Gene Entrez ID | pvalue | qvalue | TSS distance | eQTL type |
|---|---|---|---|---|---|---|---|---|
| rs9435589 | chr1 | 234872443 | IGSF9B | 22997 | 0.11 | trans | ||
| rs6753473 | chr2 | 26526418 | IGSF9B | 22997 | 1.7E-4 | trans | ||
| rs16829545 | chr2 | 151977407 | IGSF9B | 22997 | 9.27E-12 | trans | ||
| rs7584986 | chr2 | 184111432 | IGSF9B | 22997 | 0.05 | trans | ||
| rs6807632 | chr3 | 111395567 | IGSF9B | 22997 | 0.19 | trans | ||
| rs10474151 | chr5 | 84286402 | IGSF9B | 22997 | 0.18 | trans | ||
| rs1368303 | chr5 | 147672388 | IGSF9B | 22997 | 0.03 | trans | ||
| rs17166659 | chr7 | 132342143 | IGSF9B | 22997 | 0.09 | trans | ||
| rs1020772 | chr9 | 76532511 | IGSF9B | 22997 | 0.17 | trans | ||
| rs3025425 | chr9 | 136523165 | IGSF9B | 22997 | 0.1 | trans | ||
| rs10834670 | chr11 | 25404015 | IGSF9B | 22997 | 0.15 | trans | ||
| rs10834671 | chr11 | 25404269 | IGSF9B | 22997 | 0.03 | trans | ||
| rs1526959 | chr12 | 79753789 | IGSF9B | 22997 | 0.11 | trans | ||
| rs11066476 | chr12 | 113465366 | IGSF9B | 22997 | 0.18 | trans | ||
| rs16955618 | chr15 | 29937543 | IGSF9B | 22997 | 1.021E-9 | trans |
Section II. Transcriptome annotation
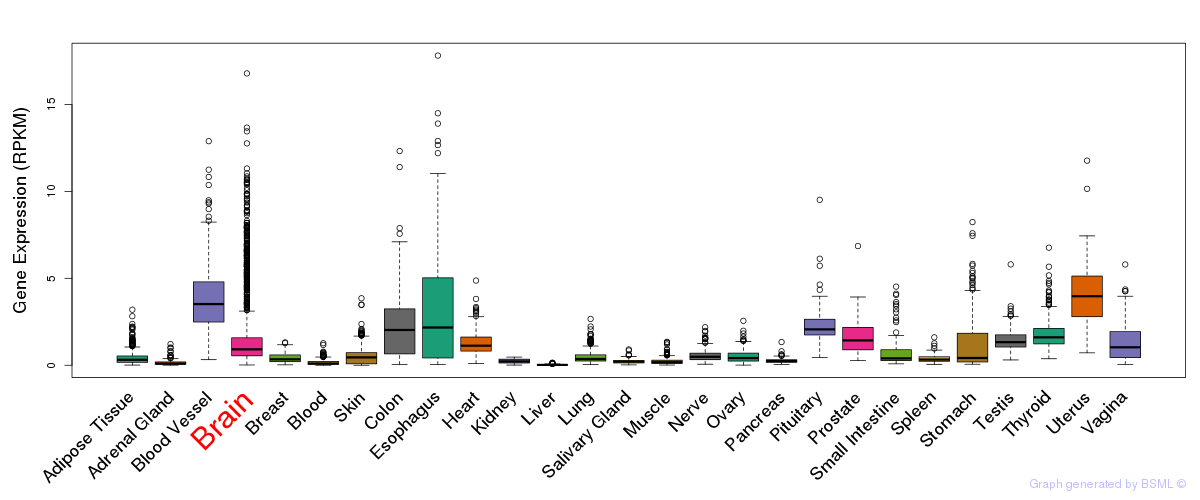
General gene expression (GTEx)
Gene expression during devlopment (BrainCloud)
Footnote:
A total of 269 time points ploted, with n=38 fetal samples (x=1:38). Each triangle represents one time point.
Gene expression of temporal and spatial changes (BrainSpan)
Footnote:
SC: sub-cortical regions; SM: sensory-motor regions; FC: frontal cortex; and TP: temporal-parietal cortex
ST1: fetal (13 - 26 postconception weeks), ST2: early infancy to late childhood (4 months to 11 years), and ST3: adolescence to adulthood (13 - 23 years)
The bar shown representes the lower 25% and upper 25% of the expression distribution.
Top co-expressed genes in brain regions
| Top 10 positively co-expressed genes | ||
| Gene | Pearson's Correlation | Spearman's Correlation |
| TPPP | 0.93 | 0.87 |
| SIRPA | 0.92 | 0.91 |
| PACSIN1 | 0.92 | 0.88 |
| SEPT8 | 0.91 | 0.92 |
| STAT6 | 0.90 | 0.87 |
| MAST3 | 0.90 | 0.82 |
| PCDH9 | 0.89 | 0.78 |
| CAMK2A | 0.89 | 0.85 |
| SUSD5 | 0.89 | 0.89 |
| SYNPO | 0.89 | 0.87 |
| Top 10 negatively co-expressed genes | ||
| Gene | Pearson's Correlation | Spearman's Correlation |
| BCL7C | -0.62 | -0.74 |
| C9orf46 | -0.59 | -0.71 |
| TUBB2B | -0.58 | -0.61 |
| TRAF4 | -0.58 | -0.67 |
| RPL18 | -0.57 | -0.77 |
| RPS19P3 | -0.57 | -0.79 |
| RPS8 | -0.57 | -0.74 |
| DYNLT1 | -0.57 | -0.75 |
| KIAA1949 | -0.57 | -0.50 |
| RPL32 | -0.56 | -0.72 |
Section V. Pathway annotation
| Pathway name | Pathway size | # SZGR 2.0 genes in pathway | Info |
|---|---|---|---|
| PUJANA BRCA1 PCC NETWORK | 1652 | 1023 | All SZGR 2.0 genes in this pathway |
| PUJANA ATM PCC NETWORK | 1442 | 892 | All SZGR 2.0 genes in this pathway |
| YAGI AML WITH INV 16 TRANSLOCATION | 422 | 277 | All SZGR 2.0 genes in this pathway |