Gene Page: FAIM2
Summary ?
| GeneID | 23017 |
| Symbol | FAIM2 |
| Synonyms | LFG|LFG2|NGP35|NMP35|TMBIM2 |
| Description | Fas apoptotic inhibitory molecule 2 |
| Reference | MIM:604306|HGNC:HGNC:17067|Ensembl:ENSG00000135472|HPRD:09184|Vega:OTTHUMG00000169808 |
| Gene type | protein-coding |
| Map location | 12q13 |
| Pascal p-value | 0.607 |
| Sherlock p-value | 0.2 |
| Fetal beta | -1.924 |
| DMG | 1 (# studies) |
Gene in Data Sources
| Gene set name | Method of gene set | Description | Info |
|---|---|---|---|
| CV:PGCnp | Genome-wide Association Study | GWAS | |
| DMG:Wockner_2014 | Genome-wide DNA methylation analysis | This dataset includes 4641 differentially methylated probes corresponding to 2929 unique genes between schizophrenia patients (n=24) and controls (n=24). | 1 |
| GO_Annotation | Mapping neuro-related keywords to Gene Ontology annotations | Hits with neuro-related keywords: 1 |
Section I. Genetics and epigenetics annotation
 Differentially methylated gene
| Probe | Chromosome | Position | Nearest gene | P (dis) | Beta (dis) | FDR (dis) | Study |
|---|---|---|---|---|---|---|---|
| cg22522920 | 12 | 50276512 | FAIM2 | 1.19E-4 | -0.311 | 0.029 | DMG:Wockner_2014 |
Section II. Transcriptome annotation
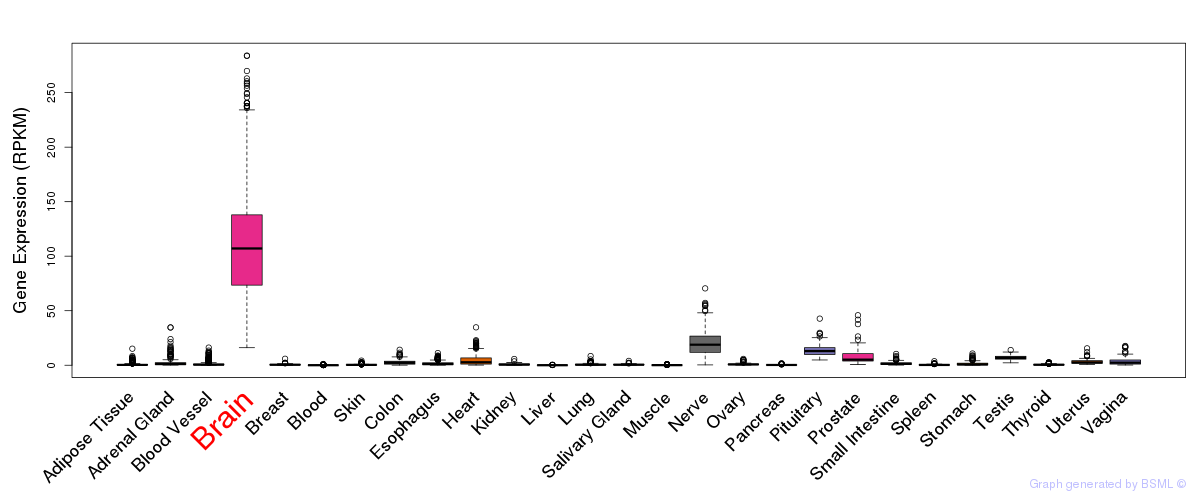
General gene expression (GTEx)
Gene expression during devlopment (BrainCloud)
Footnote:
A total of 269 time points ploted, with n=38 fetal samples (x=1:38). Each triangle represents one time point.
Gene expression of temporal and spatial changes (BrainSpan)
Footnote:
SC: sub-cortical regions; SM: sensory-motor regions; FC: frontal cortex; and TP: temporal-parietal cortex
ST1: fetal (13 - 26 postconception weeks), ST2: early infancy to late childhood (4 months to 11 years), and ST3: adolescence to adulthood (13 - 23 years)
The bar shown representes the lower 25% and upper 25% of the expression distribution.
Top co-expressed genes in brain regions
| Top 10 positively co-expressed genes | ||
| Gene | Pearson's Correlation | Spearman's Correlation |
| ZMYM4 | 0.94 | 0.97 |
| TAF2 | 0.94 | 0.95 |
| EIF4G2 | 0.94 | 0.96 |
| SCYL2 | 0.94 | 0.96 |
| SMARCAD1 | 0.94 | 0.96 |
| APAF1 | 0.94 | 0.92 |
| CAPN7 | 0.93 | 0.95 |
| VEZT | 0.93 | 0.96 |
| HSDL1 | 0.93 | 0.96 |
| DHX57 | 0.93 | 0.95 |
| Top 10 negatively co-expressed genes | ||
| Gene | Pearson's Correlation | Spearman's Correlation |
| AF347015.31 | -0.74 | -0.90 |
| HLA-F | -0.74 | -0.80 |
| MT-CO2 | -0.73 | -0.91 |
| AF347015.27 | -0.73 | -0.88 |
| FXYD1 | -0.72 | -0.89 |
| AF347015.33 | -0.72 | -0.88 |
| AIFM3 | -0.72 | -0.78 |
| TSC22D4 | -0.72 | -0.81 |
| MT-CYB | -0.71 | -0.88 |
| C5orf53 | -0.70 | -0.73 |
Section III. Gene Ontology annotation
| Molecular function | GO term | Evidence | Neuro keywords | PubMed ID |
|---|---|---|---|---|
| GO:0005515 | protein binding | NAS | 16964429 | |
| Biological process | GO term | Evidence | Neuro keywords | PubMed ID |
| GO:0006916 | anti-apoptosis | NAS | 10535980 | |
| GO:0006915 | apoptosis | IEA | - | |
| Cellular component | GO term | Evidence | Neuro keywords | PubMed ID |
| GO:0045211 | postsynaptic membrane | IEA | Synap, Neurotransmitter (GO term level: 5) | - |
| GO:0045202 | synapse | IEA | neuron, Synap, Neurotransmitter, Glial (GO term level: 2) | - |
| GO:0016021 | integral to membrane | IEA | - | |
| GO:0005886 | plasma membrane | IEA | - | |
| GO:0030054 | cell junction | IEA | - |
Section V. Pathway annotation
| Pathway name | Pathway size | # SZGR 2.0 genes in pathway | Info |
|---|---|---|---|
| ST FAS SIGNALING PATHWAY | 65 | 54 | All SZGR 2.0 genes in this pathway |
| PID FAS PATHWAY | 38 | 29 | All SZGR 2.0 genes in this pathway |
| SABATES COLORECTAL ADENOMA UP | 141 | 75 | All SZGR 2.0 genes in this pathway |
| PENG RAPAMYCIN RESPONSE UP | 203 | 130 | All SZGR 2.0 genes in this pathway |
| BLALOCK ALZHEIMERS DISEASE DN | 1237 | 837 | All SZGR 2.0 genes in this pathway |
| BLALOCK ALZHEIMERS DISEASE INCIPIENT DN | 165 | 106 | All SZGR 2.0 genes in this pathway |
| CHENG RESPONSE TO NICKEL ACETATE | 45 | 29 | All SZGR 2.0 genes in this pathway |
| MONNIER POSTRADIATION TUMOR ESCAPE UP | 393 | 244 | All SZGR 2.0 genes in this pathway |
| LEIN NEURON MARKERS | 69 | 45 | All SZGR 2.0 genes in this pathway |
| SMID BREAST CANCER RELAPSE IN BONE UP | 97 | 61 | All SZGR 2.0 genes in this pathway |
| SMID BREAST CANCER ERBB2 UP | 147 | 83 | All SZGR 2.0 genes in this pathway |
| SMID BREAST CANCER BASAL DN | 701 | 446 | All SZGR 2.0 genes in this pathway |
| RAY TUMORIGENESIS BY ERBB2 CDC25A UP | 104 | 57 | All SZGR 2.0 genes in this pathway |
| ROME INSULIN TARGETS IN MUSCLE DN | 204 | 114 | All SZGR 2.0 genes in this pathway |
| MIKKELSEN MEF ICP WITH H3K27ME3 | 206 | 108 | All SZGR 2.0 genes in this pathway |
| MIKKELSEN ES ICP WITH H3K4ME3 | 718 | 401 | All SZGR 2.0 genes in this pathway |
| KIM ALL DISORDERS OLIGODENDROCYTE NUMBER CORR UP | 756 | 494 | All SZGR 2.0 genes in this pathway |
| DELACROIX RARG BOUND MEF | 367 | 231 | All SZGR 2.0 genes in this pathway |
| PEDRIOLI MIR31 TARGETS DN | 418 | 245 | All SZGR 2.0 genes in this pathway |
| ZWANG TRANSIENTLY UP BY 2ND EGF PULSE ONLY | 1725 | 838 | All SZGR 2.0 genes in this pathway |
Section VI. microRNA annotation
| miRNA family | Target position | miRNA ID | miRNA seq | ||
|---|---|---|---|---|---|
| UTR start | UTR end | Match method | |||
| miR-326 | 1137 | 1143 | m8 | hsa-miR-326 | CCUCUGGGCCCUUCCUCCAG |
- SZ: miRNAs which differentially expressed in brain cortex of schizophrenia patients comparing with control samples using microarray. Click here to see the list of SZ related miRNAs.
- Brain: miRNAs which are expressed in brain based on miRNA microarray expression studies. Click here to see the list of brain related miRNAs.