Gene Page: SETD1B
Summary ?
| GeneID | 23067 |
| Symbol | SETD1B |
| Synonyms | KMT2G|Set1B |
| Description | SET domain containing 1B |
| Reference | MIM:611055|HGNC:HGNC:29187|Ensembl:ENSG00000139718|Vega:OTTHUMG00000169080 |
| Gene type | protein-coding |
| Map location | 12q24.31 |
| Pascal p-value | 0.051 |
| Sherlock p-value | 0.359 |
| Fetal beta | 1.215 |
| DMG | 1 (# studies) |
| eGene | Myers' cis & trans |
| Support | Chromatin Remodeling Genes |
Gene in Data Sources
| Gene set name | Method of gene set | Description | Info |
|---|---|---|---|
| CV:PGCnp | Genome-wide Association Study | GWAS | |
| DMG:Wockner_2014 | Genome-wide DNA methylation analysis | This dataset includes 4641 differentially methylated probes corresponding to 2929 unique genes between schizophrenia patients (n=24) and controls (n=24). | 3 |
Section I. Genetics and epigenetics annotation
 Differentially methylated gene
| Probe | Chromosome | Position | Nearest gene | P (dis) | Beta (dis) | FDR (dis) | Study |
|---|---|---|---|---|---|---|---|
| cg16116313 | 12 | 122255002 | SETD1B | 4.43E-5 | 0.256 | 0.021 | DMG:Wockner_2014 |
| cg26419957 | 12 | 122252518 | SETD1B | 1.587E-4 | 0.214 | 0.032 | DMG:Wockner_2014 |
| cg16620766 | 12 | 122268197 | SETD1B | 3.834E-4 | 0.401 | 0.043 | DMG:Wockner_2014 |
eQTL annotation
| SNP ID | Chromosome | Position | eGene | Gene Entrez ID | pvalue | qvalue | TSS distance | eQTL type |
|---|---|---|---|---|---|---|---|---|
| rs1878839 | chr2 | 171123122 | SETD1B | 23067 | 0.15 | trans | ||
| rs908784 | chr2 | 171129617 | SETD1B | 23067 | 0.15 | trans | ||
| snp_a-2175755 | 0 | SETD1B | 23067 | 0.18 | trans |
Section II. Transcriptome annotation
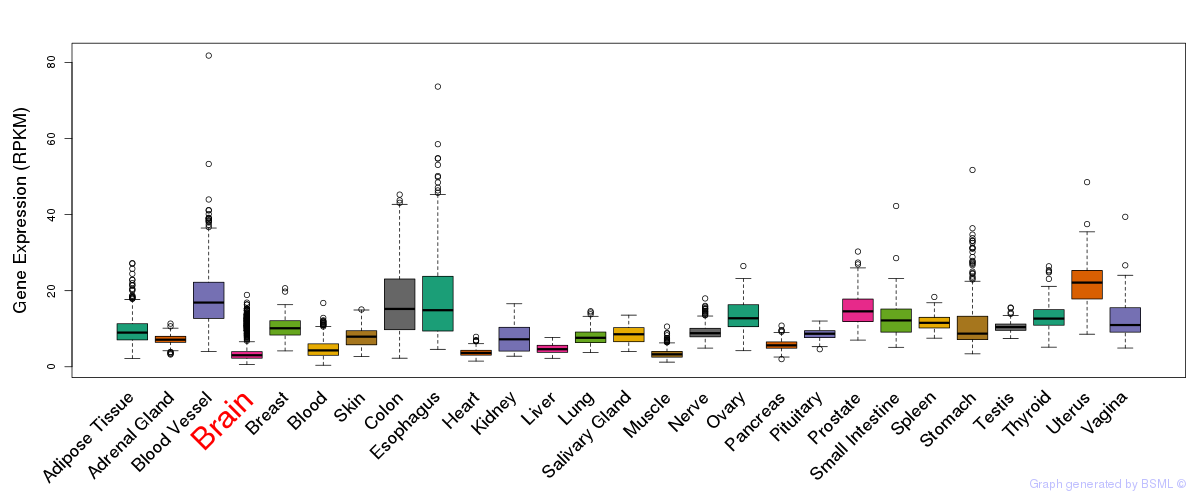
General gene expression (GTEx)
Gene expression during devlopment (BrainCloud)
Footnote:
A total of 269 time points ploted, with n=38 fetal samples (x=1:38). Each triangle represents one time point.
Gene expression of temporal and spatial changes (BrainSpan)
Footnote:
SC: sub-cortical regions; SM: sensory-motor regions; FC: frontal cortex; and TP: temporal-parietal cortex
ST1: fetal (13 - 26 postconception weeks), ST2: early infancy to late childhood (4 months to 11 years), and ST3: adolescence to adulthood (13 - 23 years)
The bar shown representes the lower 25% and upper 25% of the expression distribution.
Top co-expressed genes in brain regions
| Top 10 positively co-expressed genes | ||
| Gene | Pearson's Correlation | Spearman's Correlation |
| UBR3 | 0.96 | 0.96 |
| GARNL1 | 0.95 | 0.95 |
| ATG2B | 0.95 | 0.94 |
| DMXL1 | 0.94 | 0.93 |
| KIAA1128 | 0.94 | 0.95 |
| WDR7 | 0.94 | 0.94 |
| CLTC | 0.94 | 0.93 |
| OPA1 | 0.94 | 0.93 |
| AKAP11 | 0.94 | 0.94 |
| BTRC | 0.93 | 0.96 |
| Top 10 negatively co-expressed genes | ||
| Gene | Pearson's Correlation | Spearman's Correlation |
| FXYD1 | -0.60 | -0.64 |
| HIGD1B | -0.60 | -0.66 |
| ENHO | -0.60 | -0.70 |
| TLCD1 | -0.59 | -0.62 |
| AF347015.21 | -0.58 | -0.63 |
| PLA2G5 | -0.58 | -0.63 |
| MT-CO2 | -0.58 | -0.64 |
| EIF4EBP3 | -0.58 | -0.63 |
| C1orf54 | -0.57 | -0.69 |
| AF347015.31 | -0.57 | -0.63 |
Section V. Pathway annotation
| Pathway name | Pathway size | # SZGR 2.0 genes in pathway | Info |
|---|---|---|---|
| KEGG LYSINE DEGRADATION | 44 | 29 | All SZGR 2.0 genes in this pathway |
| RUTELLA RESPONSE TO CSF2RB AND IL4 DN | 315 | 201 | All SZGR 2.0 genes in this pathway |
| RUTELLA RESPONSE TO HGF DN | 235 | 144 | All SZGR 2.0 genes in this pathway |
| RUTELLA RESPONSE TO HGF VS CSF2RB AND IL4 DN | 245 | 150 | All SZGR 2.0 genes in this pathway |
| MIKKELSEN ES ICP WITH H3K4ME3 | 718 | 401 | All SZGR 2.0 genes in this pathway |
| LI INDUCED T TO NATURAL KILLER DN | 116 | 83 | All SZGR 2.0 genes in this pathway |