Gene Page: CMTR1
Summary ?
| GeneID | 23070 |
| Symbol | CMTR1 |
| Synonyms | FTSJD2|KIAA0082|MTr1|hMTr1 |
| Description | cap methyltransferase 1 |
| Reference | MIM:616189|HGNC:HGNC:21077|Ensembl:ENSG00000137200|HPRD:08305|Vega:OTTHUMG00000014624 |
| Gene type | protein-coding |
| Map location | 6p21.2 |
| DEG p-value | DEG:Maycox_2009:CC_BA10_fold_change=-1.11:CC_BA10_disease_P=0.0398:HBB_BA9_fold_change=-1.15:HBB_BA9_disease_P=0.0071 |
Gene in Data Sources
| Gene set name | Method of gene set | Description | Info |
|---|---|---|---|
| CV:PGCnp | Genome-wide Association Study | GWAS | |
| DEG:Maycox_2009 | Microarray to determine the expression of over 30000 mRNA transcripts in post-mortem tissue | We included 51 genes whose expression changes are common between two schizophrenia cohorts. |
Section I. Genetics and epigenetics annotation
 eQTL annotation
| SNP ID | Chromosome | Position | eGene | Gene Entrez ID | pvalue | qvalue | TSS distance | eQTL type |
|---|---|---|---|---|---|---|---|---|
| rs7739958 | chr6 | 36954948 | FTSJD2 | 23070 | 0.12 | cis | ||
| rs1570116 | chr6 | 36957343 | FTSJD2 | 23070 | 0.13 | cis | ||
| rs7743783 | chr6 | 36958992 | FTSJD2 | 23070 | 0.14 | cis | ||
| rs1753286 | chr6 | 36970270 | FTSJD2 | 23070 | 0.16 | cis | ||
| rs12677942 | chr8 | 31539941 | FTSJD2 | 23070 | 0.14 | trans | ||
| rs16878286 | chr8 | 31646175 | FTSJD2 | 23070 | 0.2 | trans | ||
| rs16878317 | chr8 | 31657853 | FTSJD2 | 23070 | 0.13 | trans |
Section II. Transcriptome annotation
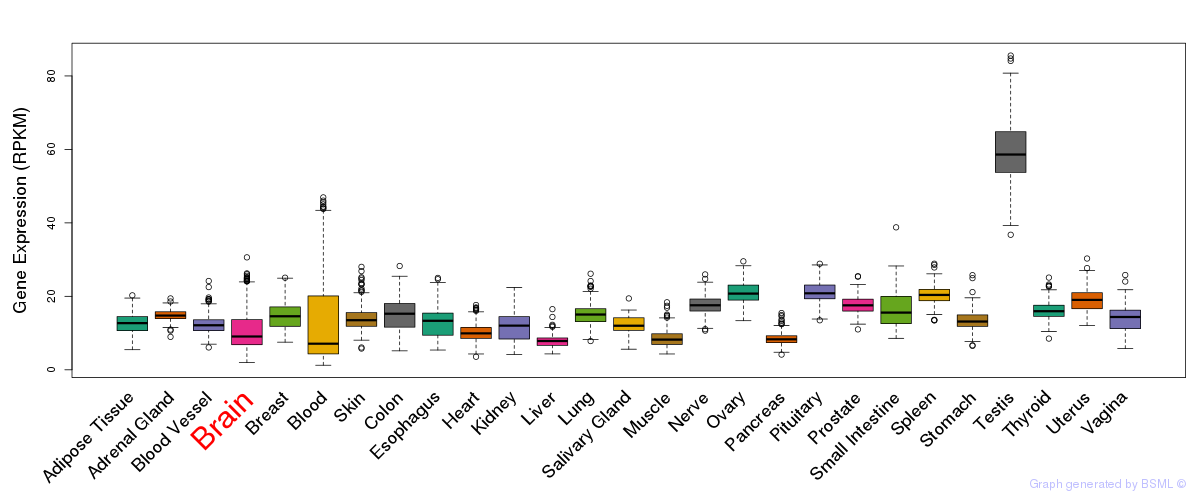
General gene expression (GTEx)
Gene expression of temporal and spatial changes (BrainSpan)
Footnote:
SC: sub-cortical regions; SM: sensory-motor regions; FC: frontal cortex; and TP: temporal-parietal cortex
ST1: fetal (13 - 26 postconception weeks), ST2: early infancy to late childhood (4 months to 11 years), and ST3: adolescence to adulthood (13 - 23 years)
The bar shown representes the lower 25% and upper 25% of the expression distribution.
Top co-expressed genes in brain regions
| Top 10 positively co-expressed genes | ||
| Gene | Pearson's Correlation | Spearman's Correlation |
| TECPR2 | 0.86 | 0.86 |
| NFE2L1 | 0.85 | 0.85 |
| AGPAT3 | 0.84 | 0.85 |
| TBC1D9B | 0.84 | 0.84 |
| SPATA2 | 0.83 | 0.85 |
| AP006216.1 | 0.83 | 0.86 |
| ZHX3 | 0.83 | 0.86 |
| SIDT2 | 0.82 | 0.81 |
| MAN2A2 | 0.81 | 0.83 |
| STAT5B | 0.81 | 0.84 |
| Top 10 negatively co-expressed genes | ||
| Gene | Pearson's Correlation | Spearman's Correlation |
| GNG11 | -0.56 | -0.54 |
| IL32 | -0.54 | -0.54 |
| SYCP3 | -0.52 | -0.53 |
| AL050337.1 | -0.50 | -0.51 |
| AF347015.21 | -0.50 | -0.40 |
| C1orf54 | -0.49 | -0.47 |
| FAM159B | -0.48 | -0.60 |
| CLEC3B | -0.46 | -0.46 |
| CLEC2B | -0.46 | -0.43 |
| C1orf61 | -0.46 | -0.43 |
Section III. Gene Ontology annotation
| Molecular function | GO term | Evidence | Neuro keywords | PubMed ID |
|---|---|---|---|---|
| GO:0003676 | nucleic acid binding | IEA | - | |
| GO:0005515 | protein binding | IEA | - | |
| Cellular component | GO term | Evidence | Neuro keywords | PubMed ID |
| GO:0005622 | intracellular | IEA | - |
Section VI. microRNA annotation
| miRNA family | Target position | miRNA ID | miRNA seq | ||
|---|---|---|---|---|---|
| UTR start | UTR end | Match method | |||
| miR-136 | 1175 | 1181 | 1A | hsa-miR-136 | ACUCCAUUUGUUUUGAUGAUGGA |
| miR-148/152 | 1186 | 1192 | 1A | hsa-miR-148a | UCAGUGCACUACAGAACUUUGU |
| hsa-miR-152brain | UCAGUGCAUGACAGAACUUGGG | ||||
| hsa-miR-148b | UCAGUGCAUCACAGAACUUUGU | ||||
- SZ: miRNAs which differentially expressed in brain cortex of schizophrenia patients comparing with control samples using microarray. Click here to see the list of SZ related miRNAs.
- Brain: miRNAs which are expressed in brain based on miRNA microarray expression studies. Click here to see the list of brain related miRNAs.